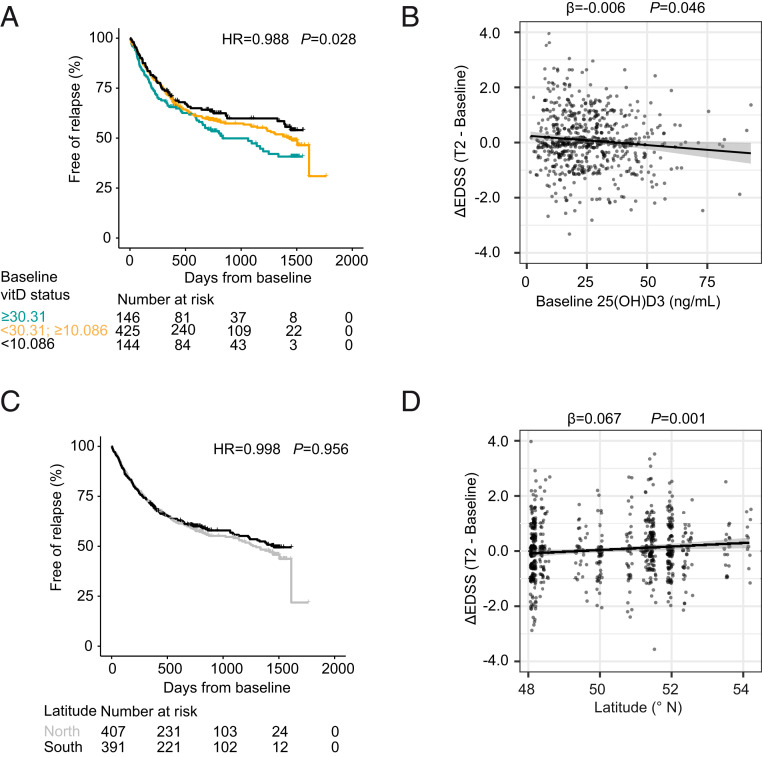
Fig. 3.
Influence of vitD and latitude on risk for relapses and disability accumulation. (A) Time-to-event curves displaying the proportion of relapse-free patients over time for the NationMS cohort grouped by serum 25(OH)D3 levels (color code: jade = the 20% of patients with the lowest 25(OH)D3 levels, cutpoint: <10.086 ng/mL; black = the 20% of patients with the highest 25(OH)D3 levels, cutpoint: ≥30.31 ng/mL; orange = patients in between) and complemented with a table displaying the number at risk over time (n = 715). (B) Dotplot for the change in EDSS (ΔEDSS) in relation to baseline 25(OH)D3 levels with least-squares linear regression line ± SE (n = 612). (C) Time-to-event curves displaying the proportion of relapse-free patients over time for the NationMS cohort grouped by latitude (north defined as greater than or equal to median latitude within the cohort = 50.85 °N) and complemented with a table displaying the number at risk over time (n = 798). (D) Dotplot for the ΔEDSS in relation to latitude with least-squares regression line ± SE (n = 671). Analyses are adjusted for age, sex, BMI, smoking, alcohol consumption, clinical subtype, neurological site of first manifestation, month of assessment, medication after baseline, whether medication was changed during the study, and center variability. Differences in baseline severity were adjusted by using the baseline MSSS and the number of Gd-enhancing lesions at baseline as covariates. Adjustment for center was omitted when analyzing the effect of latitude.

