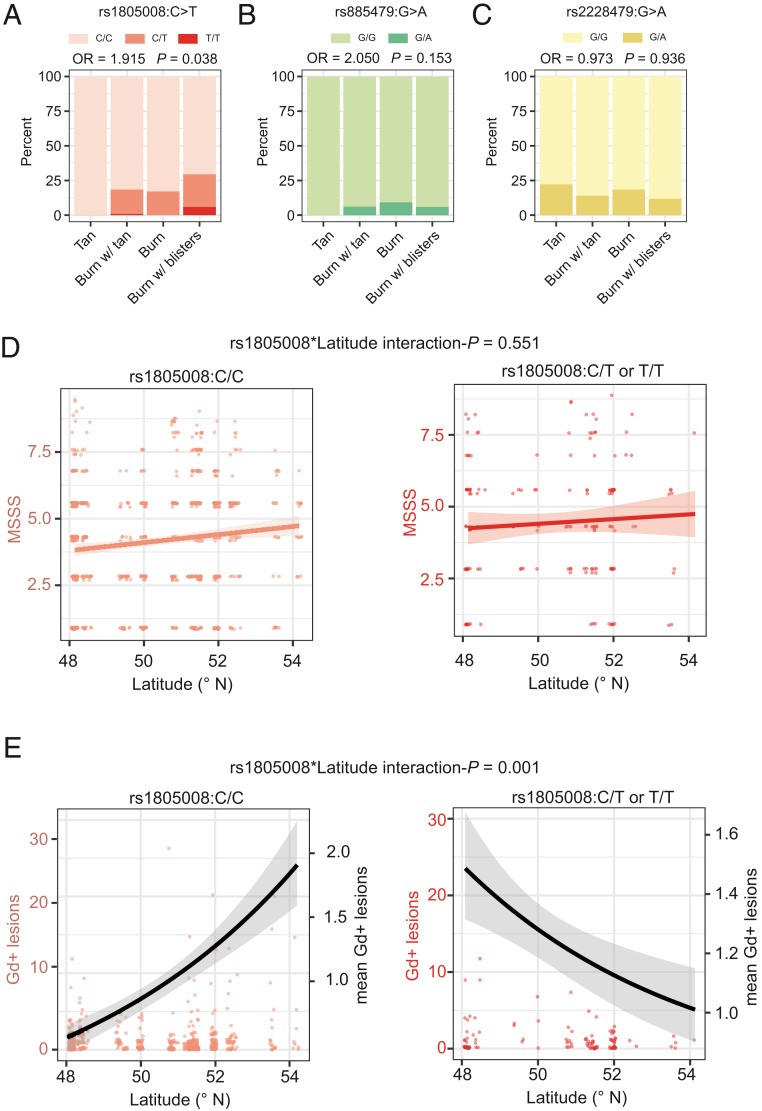
Fig. 4.
Interaction of MC1R genotype and sun exposure. (A–C) Barplots displaying the fraction of total patients (ntotal = 229) who reported their reactions to sun exposure at noon in summer for the MC1R genotypes (A) rs1805008(C>T), (B) rs885479(G>A), and (C) rs2228479(G>A). This analysis was adjusted for age, sex, BMI, smoking, alcohol consumption, and population stratification. (D) Dotplots for MSSS in relation to latitude with least-squares linear regression line stratified by rs1805008 genotype. (E) Dotplots for Gd-enhancing lesions in relation to latitude (left y axis) complemented with the mean number of lesions (black line, right y axis). Analyses for D and E were adjusted for age, sex, BMI, smoking, alcohol consumption, clinical subtype, neurological site of first manifestation, month of assessment, and center. Adjustment for center was omitted when analyzing the effect of latitude.

