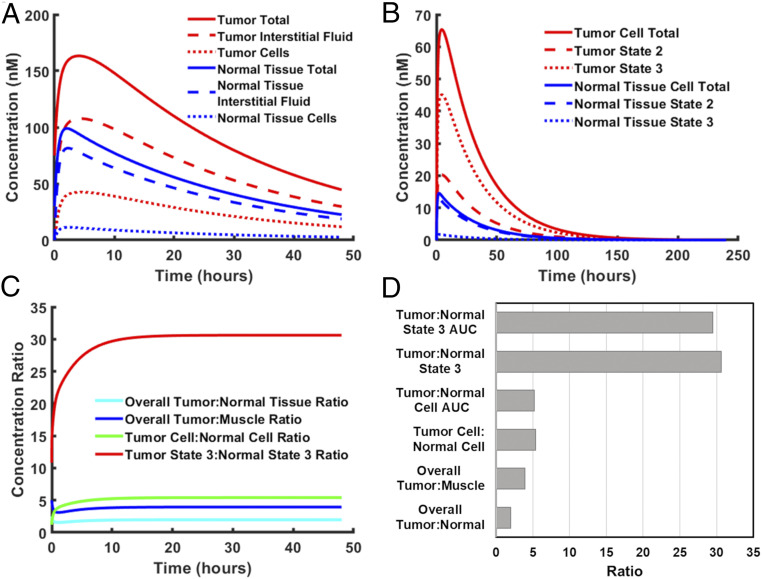
Fig. 4.
Analysis of pHLIP biodistribution. Model-predicted concentration profiles were generated for wild-type pHLIP after a single i.v. injection of 3 nmol into a mouse. (A) The total concentration, interstitial fluid concentration, and cell-bound concentration of pHLIP relative to total tumor/normal tissue volume (cells + interstitial fluid). (B) The total cell-bound concentration, state 2 concentration, and state 3 concentration of pHLIP relative to tumor/normal tissue cell volume (which excludes the interstitial fluid). (C) The respective tumor:normal tissue ratios. (D) Quantification of tumor:normal tissue AUC ratios and steady-state concentration ratios.

