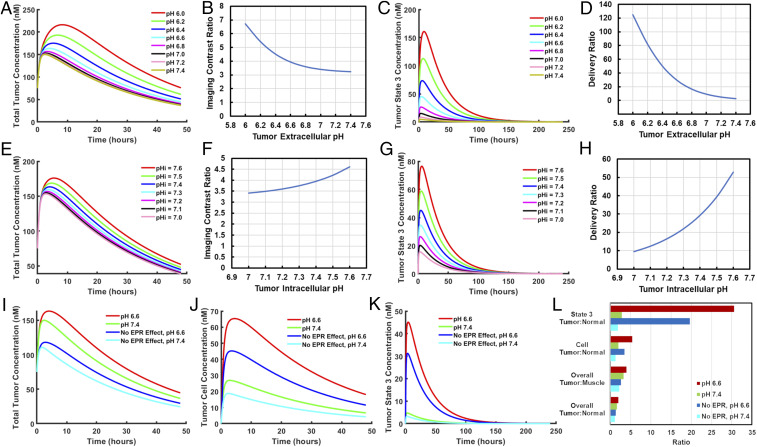
Fig. 5.
Influence of tumor pH and EPR effect on pHLIP tumor targeting and delivery. The model was run for wild-type pHLIP with tumor extracellular pH ranging from 6.0 to 7.4 while tumor intracellular pH was kept at 7.4 (A–D) or with tumor intracellular pH ranging from 7.0 to 7.6 and tumor extracellular pH kept at 6.6 (E–H). The relationships between tumor extracellular/intracellular pH and total tumor concentration (A and E), the imaging contrast ratio (B and F), tumor state 3 concentration (C and G), and the delivery ratio (D and H) are shown. The model was also run with or without tumor acidity (pH 6.6) and/or the EPR effect, respectively, and the resulting total tumor concentrations (I), tumor cell concentrations (J), tumor state 3 concentrations (K), and tumor:normal tissue contrast ratios were compared (L). Tumor cell and tumor state 3 concentrations are relative to tumor cell volume, which excludes interstitial fluid.

