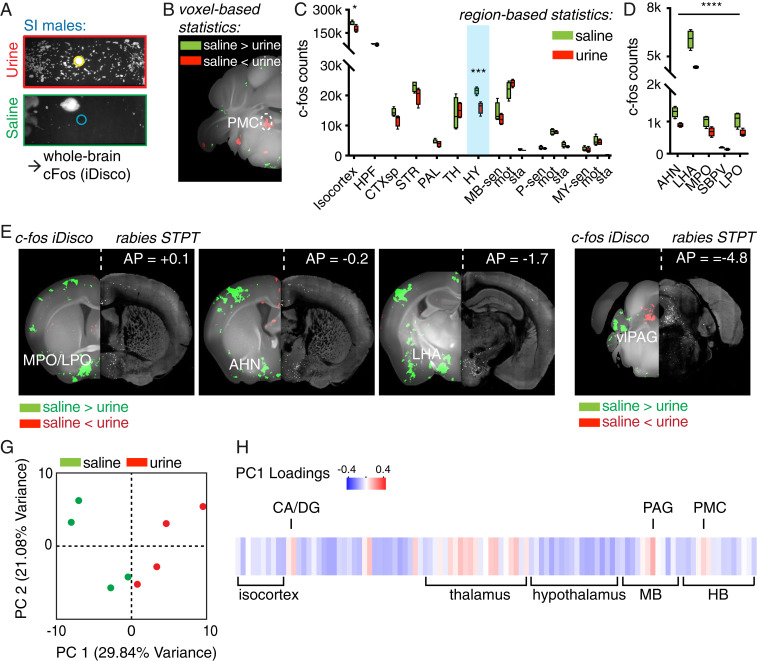
Fig. 4.
Brain circuits upstream of PMC are differentially activated during different micturition behaviors. (A) Schematic of the whole-brain Fos analysis workflow: SI males were exposed to either urine or saline, which resulted in divergent TCM. One hour after the behavior, animals were perfused, the brains were cleared, immunolabeled for Fos, imaged, and analyzed (n = 4 each for the urine and the saline conditions). (B) Maps of voxel-based statistics reveal increased numbers of Fos+ neurons in the PMC in urine-exposed animals. Green indicate statistically significant (q < 0.05, FDR = 0.05) voxels with higher Fos counts in animals exposed to saline, and red indicates higher Fos counts in animals exposed to urine. (C) Fos induction in multiple brain regions from saline- and urine-exposed animals (*q < 0.05, ***q < 0.0001, FDR = 0.05). (HPF, hippocampal formation; CTXsp, cortical subplate; STR, striatum; PAL, pallidum; HY, hypothalamus; MB-sen, midbrain, sensory related; MB, midbrain, P, pons; MY, medulla; -sen, sensory related; -mot, motor related; -sta, behavioral-state related). (D) The five hypothalamic regions with the largest differences in Fos induction across saline- and urine-exposed animals, sorted by q values (all regions q < 0.0005; refer to SI Appendix, Tables S2 and S3 for full statistics). (AHN, anterior hypothalamic nucleus; LHA, lateral hypothalamic area; MPO, medial preoptic area; SBPV, subparaventricular zone; LPO, lateral preoptic area). (E) Hypothalamic regions with differential Fos induction that project to the PMC: voxel-based statistics map from Fos (Left) and corresponding RV STPT images (Right) of putative inputs to Crh+ PMC in the same coronal slice. Each panel shows a stitched image with the left- and right-hand sides coming from different imaging modalities. (F) Ventrolateral segment of PAG (vlPAG), the major input to the PMC, displays differential Fos activation. (G) Individual mice projected onto the first two PC spaces of whole-brain Fos+ cell densities. (H) Brain-wide Fos patterns in response to urine, represented as the loadings of individual brain regions in PC1. (HB, hindbrain; CA, Ammon's horn; DG, dentate gyrus).

