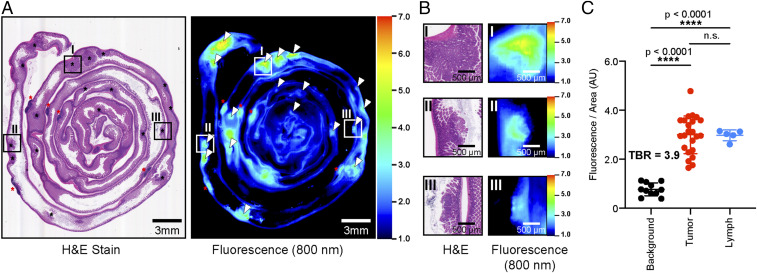
Fig. 2.
NIRF Imaging of colorectal carcinogenesis in Apcmin/+ mice using 6QC-ICG. (A) H&E and NIRF imaging of tissue block of small intestine tissue sections of a 12- to 16-wk-old Apcmin/+ mouse injected with 6QC-ICG (euthanized 14 h post infection [PI], 2.3 mg/kg). Black asterisks denote tumors; red asterisks denote lymphatic tissue. White arrowheads in NIRF image correspond to black asterisks in H&E slide. Roman numerals indicate regions that are magnified and shown in B. (B) Zoomed-in images of H&E and corresponding 800-nm fluorescence scan of tissue block. (C) Tumors and gut-associated lymph tissues (lymph) demonstrate significantly higher NIRF signals relative to normal tissue (background). Error bars represent SDs. See SI Appendix, Fig. S1, for NIRF imaging of single 5-μm H&E-stained tissue section.

