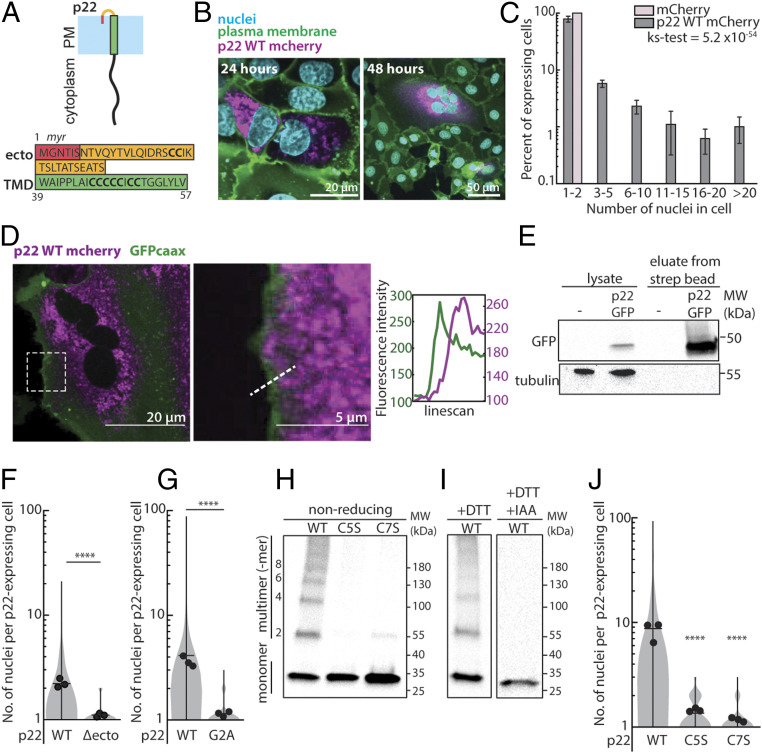
Fig. 1.
p22 is a membrane protein that multimerizes and drives cell-cell fusion. (A) Diagram of p22 topology on the plasma membrane and amino acid sequence of p22 ectodomain, predicted myristoylation, and transmembrane domain. (B) Expression of p22-mCherry (magenta) in Vero cells. Nuclei (Hoechst 33342; cyan) and plasma membrane (CellMaskDeepRed; green) are shown. (C) Nuclei distribution of cells expressing mCherry-tagged p22 and mCherry 36 h posttransfection, error bars indicate SD from three independent replicates, P value of ks-test between the two distributions is shown. (D) Representative confocal images of cells expressing p22-mCherry (magenta) and GFP-caax (plasma membrane marker; green). Contrast was adjusted in the magnified region. Magnified region and fluorescence intensity of line scan of dotted line is shown. (E) Western blot from surface biotinylation of p22-GFP–expressing cells and nontransfected cells. (F) Distribution of number of nuclei in p22-WT– and p22-Δecto–expressing cells from three independent transfections, with mean number of each replicate, average from three independent transfections shown. ****P < 0.0001 using two-tailed Student’s t test. (G) Distribution of number of nuclei in p22-WT– and p22-G2A–expressing cells from three independent transfections, mean number of each replicate, average from three independent transfections shown. ****P < 0.0001 using two-tailed Student’s t test. (H) Western blot of nonreducing SDS/PAGE of myc-tagged p22-WT, p22-C5S, p22-C7S probed with α-myc. (I) Western blot of SDS/PAGE of myc-tagged p22-WT, reduced with DTT and capped with iodoacetamide (IAA), and probed with α-myc. (J) Distribution of number of nuclei in p22-WT–, p22-C5S–, and p22-C7S–expressing cells from three independent transfections, mean number of each replicate, average from three independent transfections shown. ****P < 0.0001 using one-way ANOVA with Dunnett’s test.

