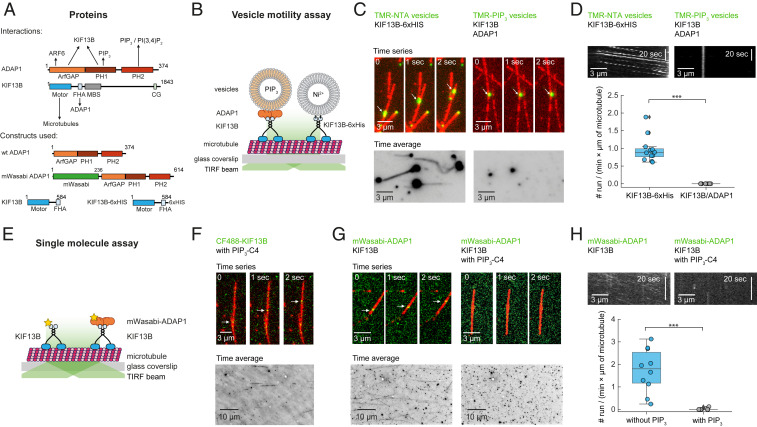
Fig. 1.
KIF13B transport of ADAP1 is inhibited by PIP3. (A) Domain architecture of ADAP1 and KIF13B and known interactions (Top). Architecture of protein constructs used in this study (Bottom). CC, coiled coil; CG, cytoskeleton-associated protein glycine-rich domain; FHA, forkhead-associated domain; MBS, membrane-associated guanylate kinase-binding stalk. (B) Assay scheme for single-vesicle motility assay. Fluorescently labeled vesicles are observed by TIRF microscopy as they are transported along microtubules by molecular motors. (C, Left) Time series of rhodamine-labeled NTA vesicles (green; 3 mol % Ni-NTA) being transported along HiLyte 647-labeled microtubules (red) in the presence of 500 nM KIF13B-6×His (Top) and corresponding time average (100 frames) of the rhodamine channel (Bottom). (C, Right) Time series of rhodamine-labeled PIP3 vesicles (green; 5 mol % PIP3) in the presence of ADAP1 (here 500 nM) and KIF13B (here 500 nM) and corresponding time average (100 frames) of the rhodamine channel (Bottom). (D) Quantification of run frequencies corresponding to C counting run events per minute and per micrometer of microtubule with one representative kymograph per condition. ***P < 0.001. (E) Assay scheme for single-molecule motility assay. Fluorescently labeled proteins are observed by TIRF microscopy along surface-immobilized microtubules. (F, Top) Time series of CF488-labeled KIF13B (green; 10 nM) walking along HiLyte 647-labeled microtubules (red) in the presence of 23 μM water-soluble PIP3-C4. (F, Bottom) Corresponding time average of the 488-nm channel (total duration 100 frames). (G, Top) Time series of 20 nM mWasabi-ADAP1 (green) with 100 nM unlabeled KIF13B in the absence (Left) or presence (Right) of 23 μM water-soluble PIP3-C4. (G, Bottom) Corresponding time average of the 488-nm channel (total duration 100 frames). (H) Quantification of run frequencies corresponding to G with one representative kymograph of the 488-nm channel per condition. ***P < 0.001. Displayed box plots encompass the 25–75th percentiles, the midline indicates the median, the whiskers extend to show the rest of the distribution and to indicate outliers.

