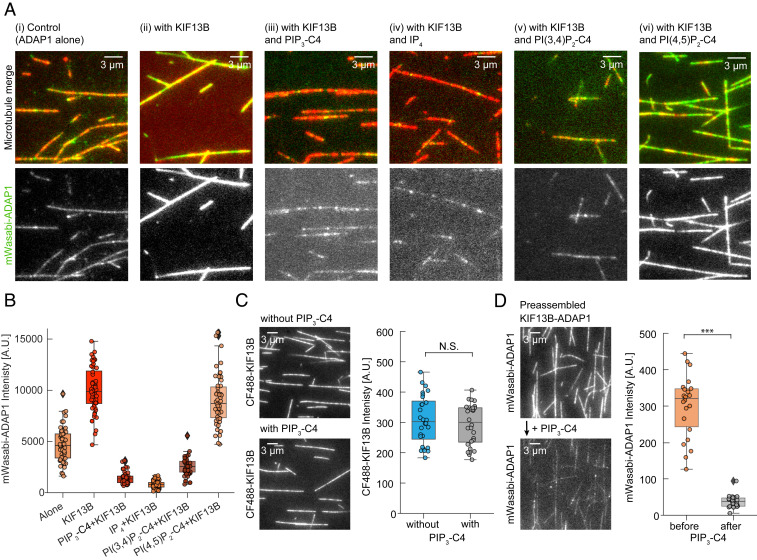
Fig. 2.
PIP3 displaces ADAP1 from microtubule-bound KIF13B. (A) Representative TIRF images of mWasabi-ADAP1 binding to stabilized and immobilized HiLyte 647-labeled microtubules in the presence or absence of AMP-PNP–bound KIF13B and different phosphoinositides. Merged images are shown (Top) (mWasabi-ADAP1 is in green and microtubules are in red) and the 488-nm mWasabi channel is shown (Bottom) in grayscale. Concentrations were 160 nM mWasabi-ADAP1, 200 nM KIF13B, 28 µM IP4, and 23 µM for all other water-soluble phosphoinositides (SI Appendix, Methods). AMP-PNP was present in all conditions at 0.5 mM. (B) Quantifications for all conditions in A. Intensities of mWasabi-ADAP1 come from at least 20 microtubules from three independent experiments per condition. A.U., arbitrary units. (C, Left) Representative TIRF image of the 488-nm channel showing AMP-PNP–bound CF488-KIF13B binding to stabilized microtubules in the absence (Top) or presence (Bottom) of 23 μM water-soluble PIP3-C4. CF488-KIF13B was present at 100 nM. (C, Right) Corresponding quantification of CF488-KIF13B signals from three independent experiments. N.S., not significant. (D, Left) Representative TIRF images of PIP3-C4 wash-in experiments. mWasabi-ADAP1 signals were recorded in the presence of AMP-PNP–KIF13B without PIP3-C4 (Top) and after (Bottom) solutions were exchanged with a solution containing mWasabi-ADAP1, AMP-PNP–KIF13B, and additionally water-soluble PIP3-C4. Protein and PIP3 concentrations were the same as in A and the time between solution exchange and image recording was ∼30 s. (D, Right) Corresponding quantification of mWasabi-ADAP1 signals before (Left) and after (Right) solution exchange from the same set of microtubules. ***P < 0.001. Displayed box plots encompass the 25–75th percentiles, the midline indicates the median, the whiskers extend to show the rest of the distribution and to indicate outliers.

