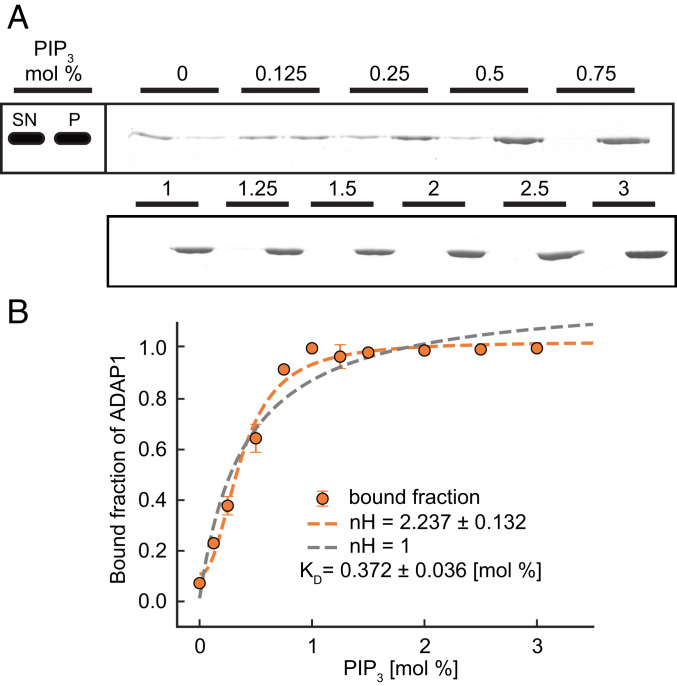
Fig. 3.
ADAP1 binds to PIP3 vesicles in a cooperative manner. (A) Pelleting assay with ADAP1 (1 µM) and vesicles (375 µM) with the indicated concentration of PIP3. A representative Coomassie brilliant blue-stained sodium dodecyl sulfate gel is shown, where the supernatant (SN) is loaded on the left and the pellet (P) on the right for each PIP3 concentration. Note that different amounts of pellet and supernatant are loaded, which is also accounted for in the quantification (see SI Appendix, Methods for details). (B) Quantification of band intensities. Plotted is the distribution of ADAP1 between pellet and supernatant for each condition together with a Hill fit for the whole dataset (orange dashed line) and compared with a fit where nH was set to 1 (gray dashed line). Error bars are SDs from two independent experiments per condition.

