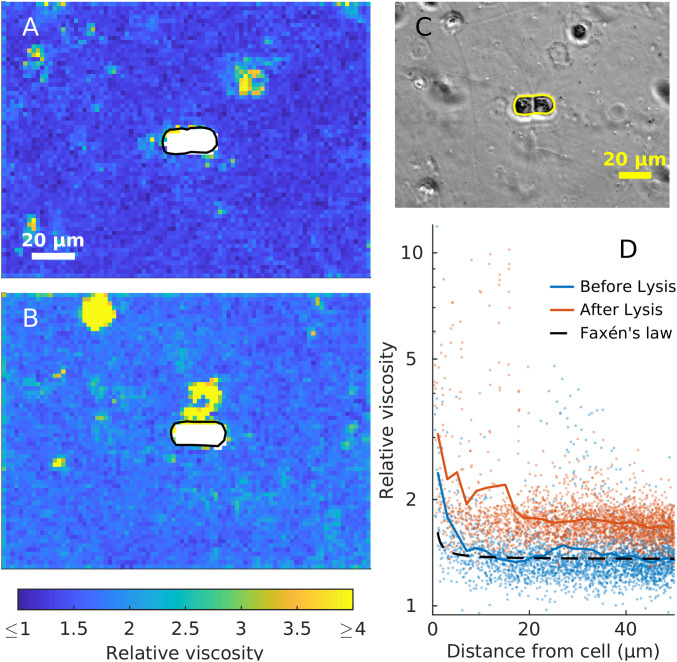
Fig. 2.
Viscosity changes around a C. affinis cell (A) before and (B) 1 h after light-induced cell lysis. (A and B) 2 × 2 µm MPTM viscosity maps. (C) Phase-contrast image at the start of the experiment. Cell boundaries are drawn in black in A and B, and yellow in C. (D) Viscosity estimates against the minimum distance to the boundary of the cell before (blue) and after (red) the lysis. Colored lines are a moving average with a 2-µm window. Dashed black line represents Faxén’s law for motion perpendicular to a solid boundary (Eq. 2).

