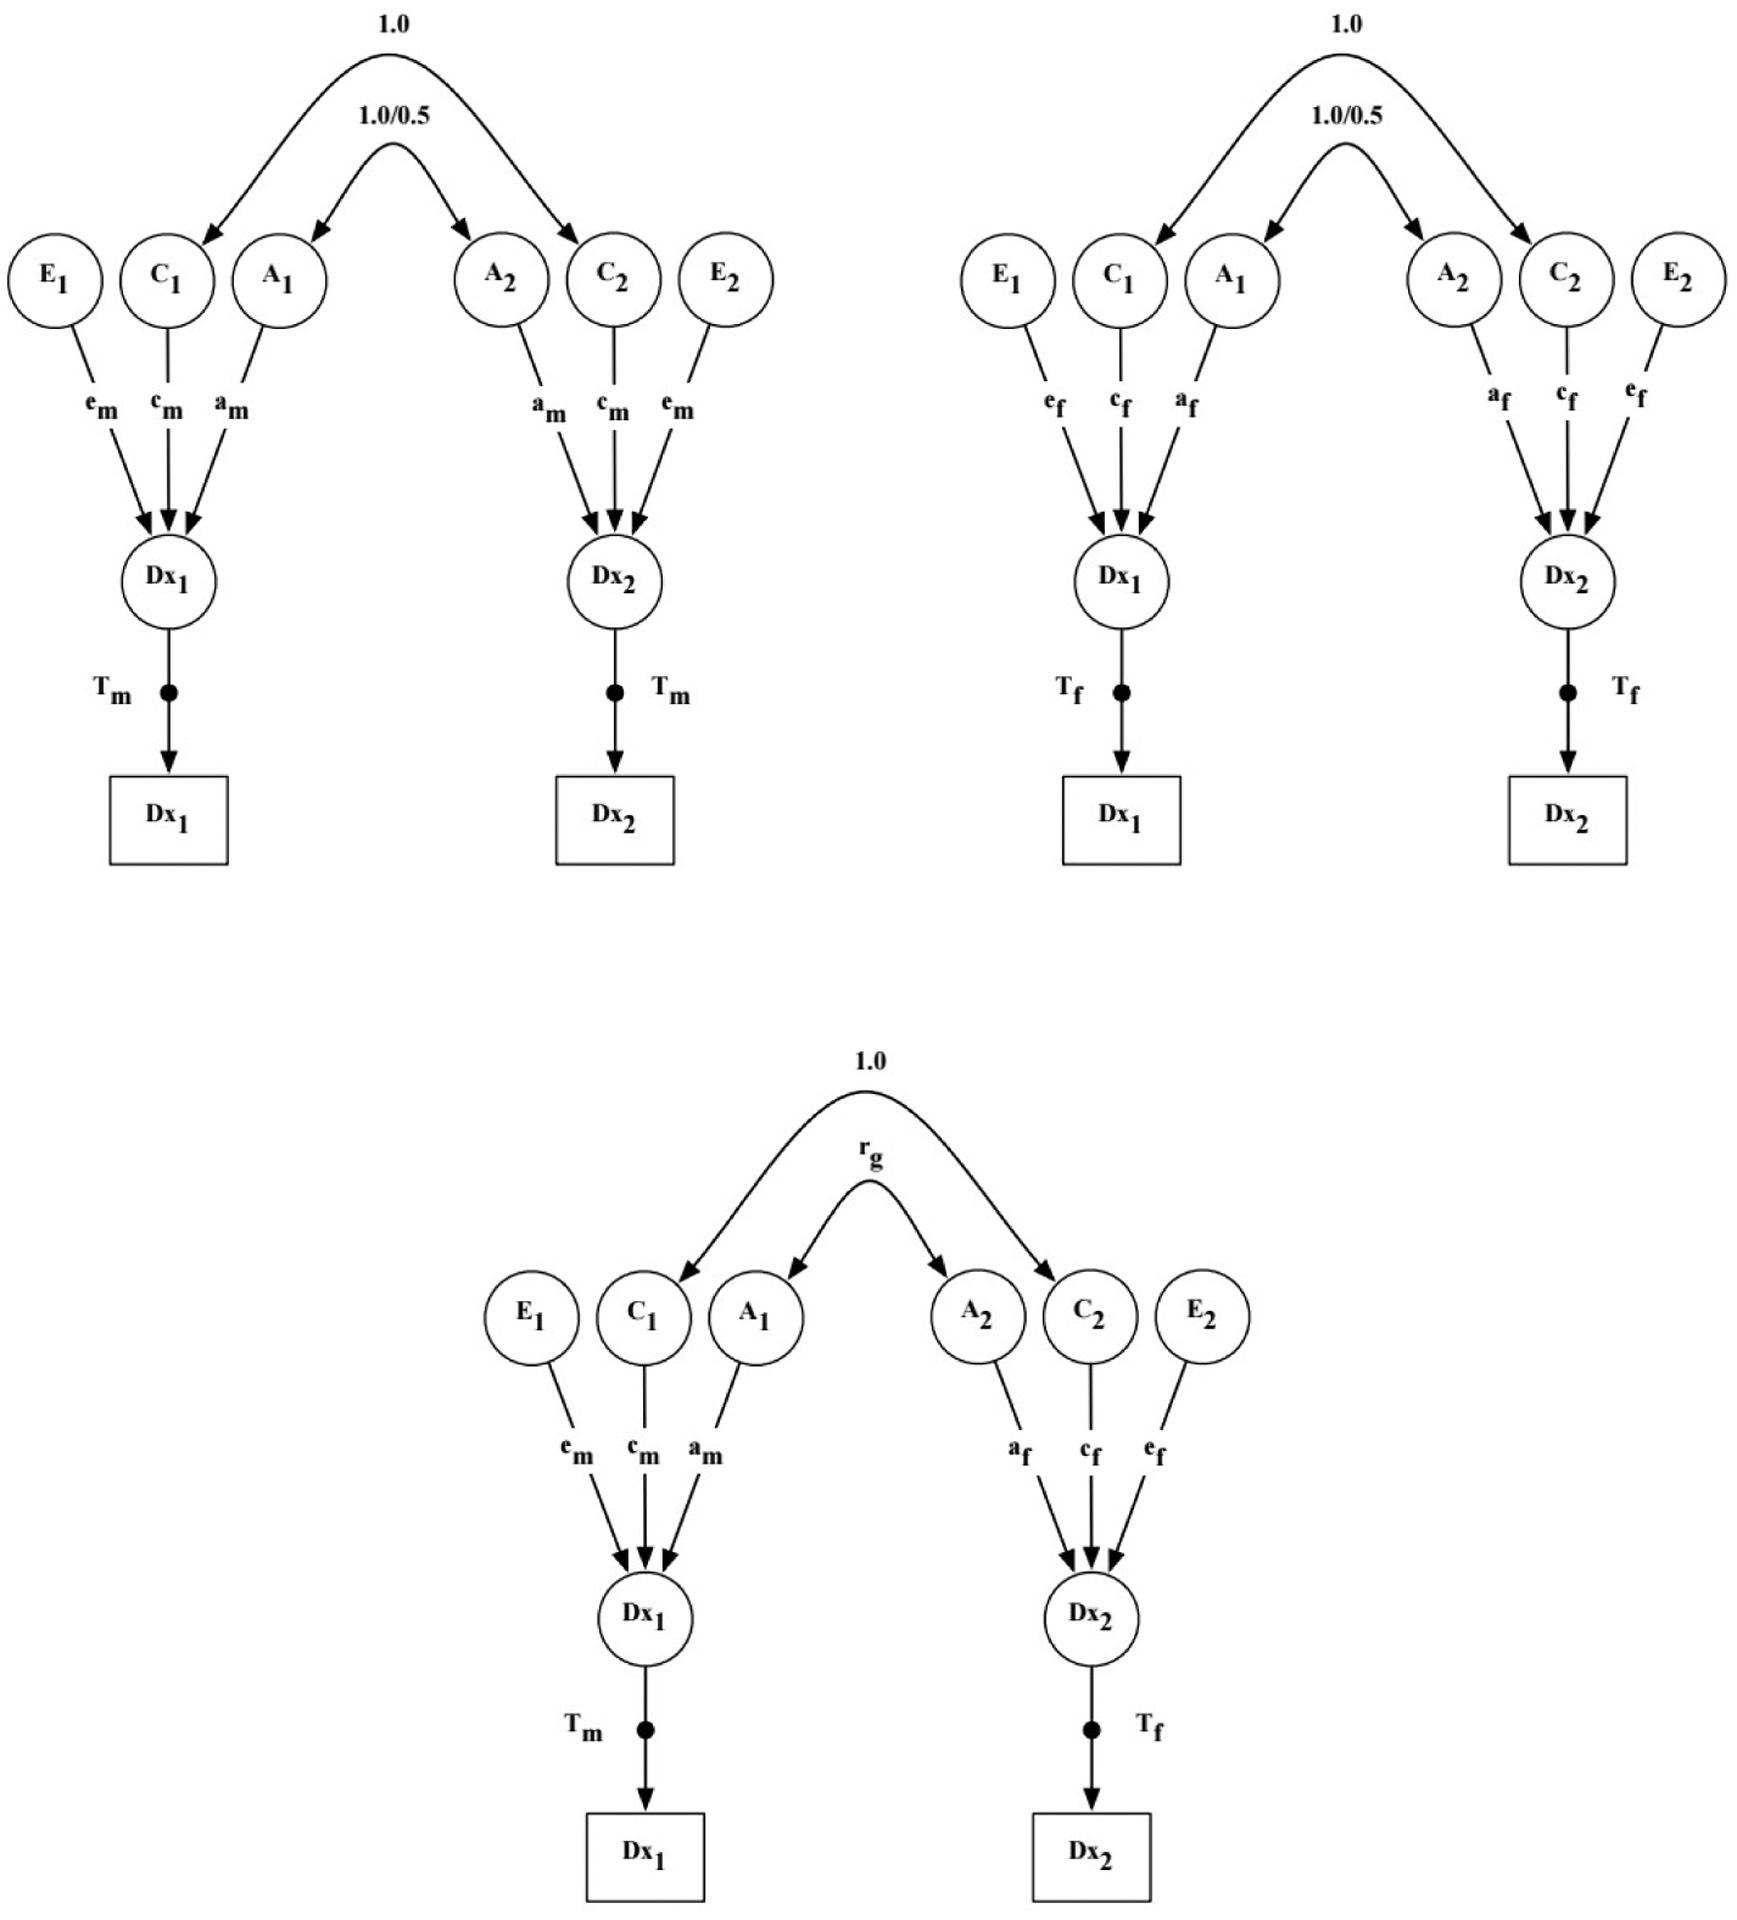
Figure 2.

Sex-limitation ACE model for binary outcomes.
Notes. A = additive genetic effects; C = shared environmental effects; E = nonshared environmental effects; Dx = dementia diagnosis; T = threshold for diagnosis of dementia; m = male twin; f = female twins; rg = genetic correlation between opposite-sex DZ twins; 1 = twin 1; 2 = twin 2. The genetic correlation between twins’ A effects is 1.0 for MZ twins and 0.5 for DZ twins. The shared environmental correlation is 1.0 for all zygosity groups. The black dot project from the latent Dx variables (circles) to the observed Dx variables (squares) represent the threshold estimates for the categorical outcome (i.e., threshold model for liabilities).
