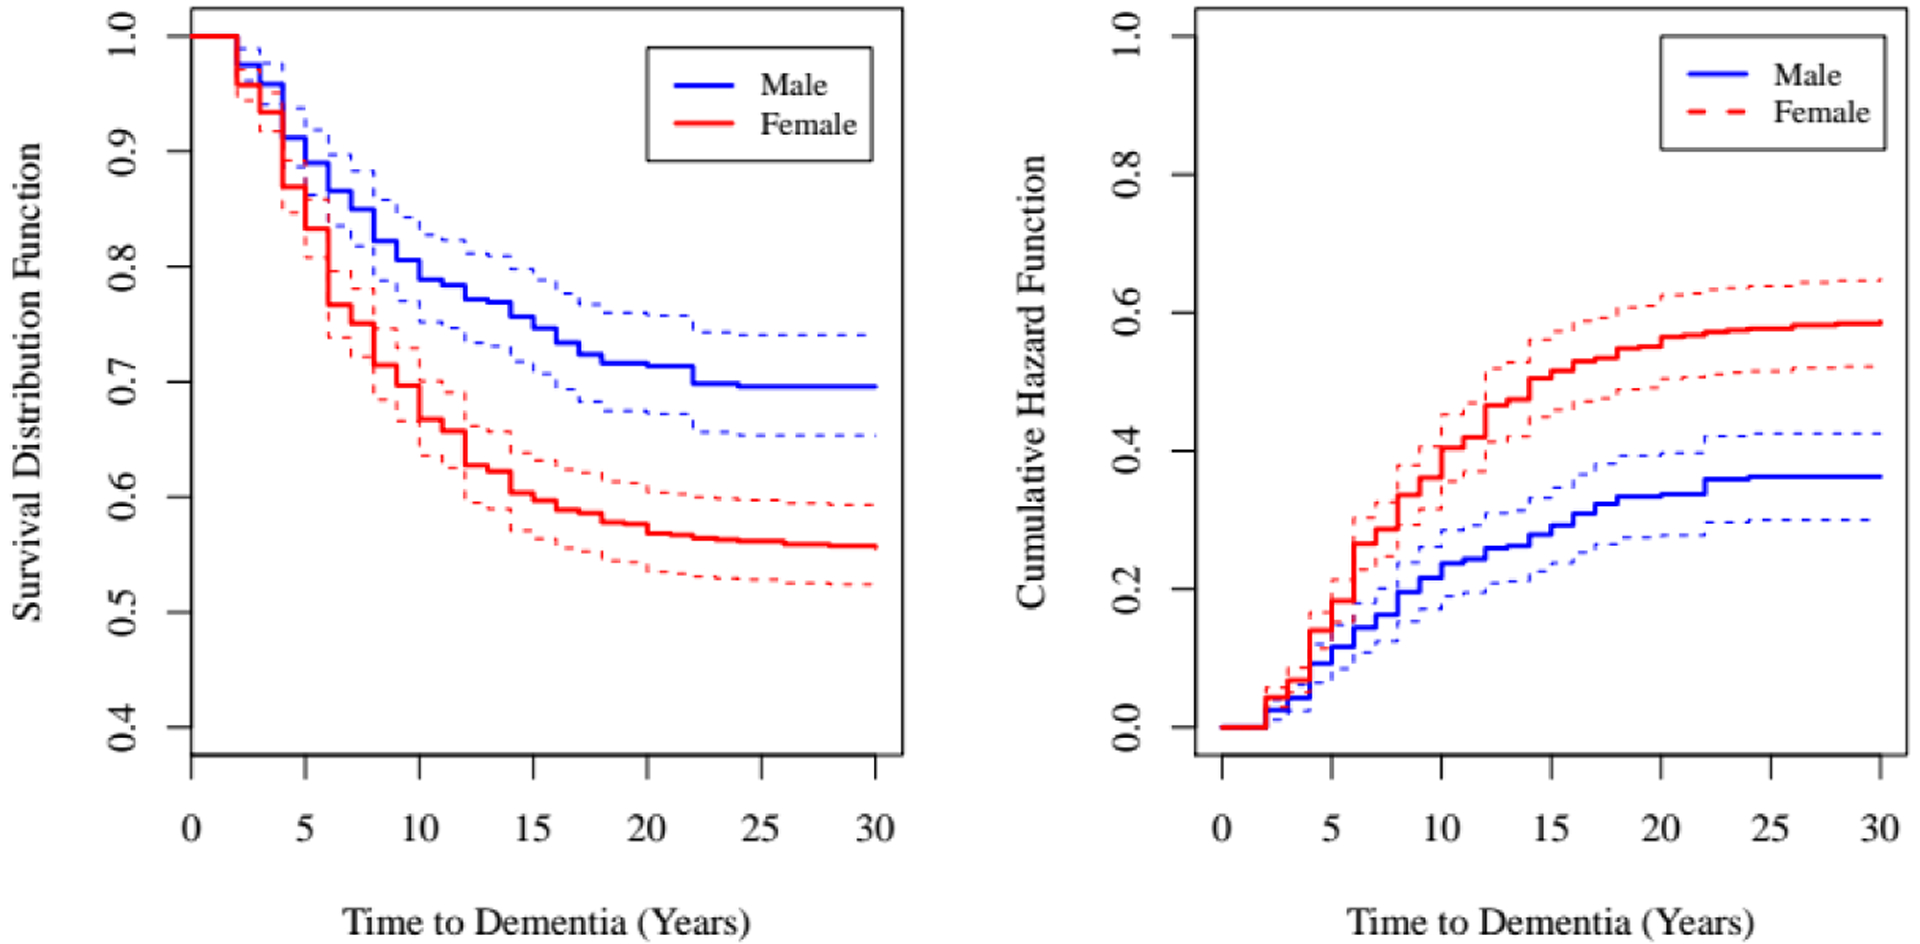
Figure 3.

Kaplan-Meier estimates of the survivor function (left) and cumulative hazard function (right) by sex.
Notes. Estimates are presented with thicker lines and 95% confidence intervals are given with thinner lines.

Kaplan-Meier estimates of the survivor function (left) and cumulative hazard function (right) by sex.
Notes. Estimates are presented with thicker lines and 95% confidence intervals are given with thinner lines.