Figure 1.

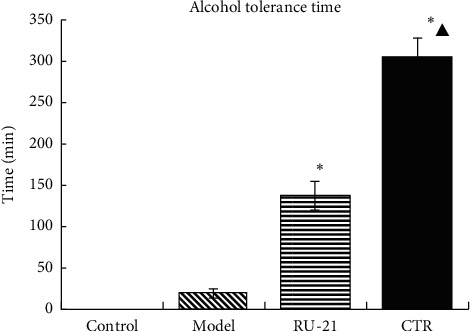
Comparison of the alcohol tolerance time among groups. ∗p < 0.01 compared with the model group, ▲p < 0.01 compared with the RU-21 group.

Comparison of the alcohol tolerance time among groups. ∗p < 0.01 compared with the model group, ▲p < 0.01 compared with the RU-21 group.