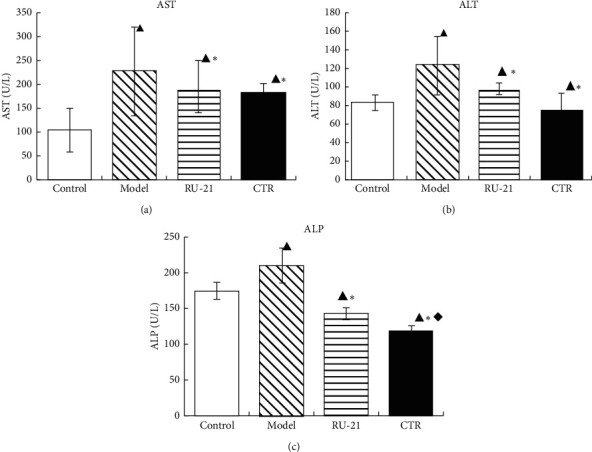
Figure 8.

Comparison of acute alcoholism in mice: the changes of liver enzyme among groups. (a) ALT; (b) AST; (c) ALP. Control: the group without alcohol or any drugs. Model: the group cured with alcohol only. RU-21: the positive control group cured with RU-21 before alcohol. CTR: the experiment group cured with the CTR before alcohol. ▲p < 0.05 compared with the control group, ∗p < 0.01 compared with the model group, and ◆p < 0.05 compared with the RU-21 group.
