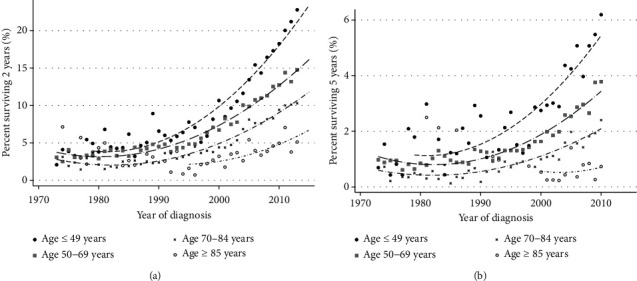
Figure 2.

(a) Changes in the proportion of metastatic lung cancer patients surviving two years as a function of age and year of diagnosis. The symbols represent data for a specific year, and the lines indicate a trend line. (b) Changes in the proportion of metastatic lung cancer patients surviving five years as a function of age and year of diagnosis. The symbols represent data for a specific year, and the lines indicate a trend line.
