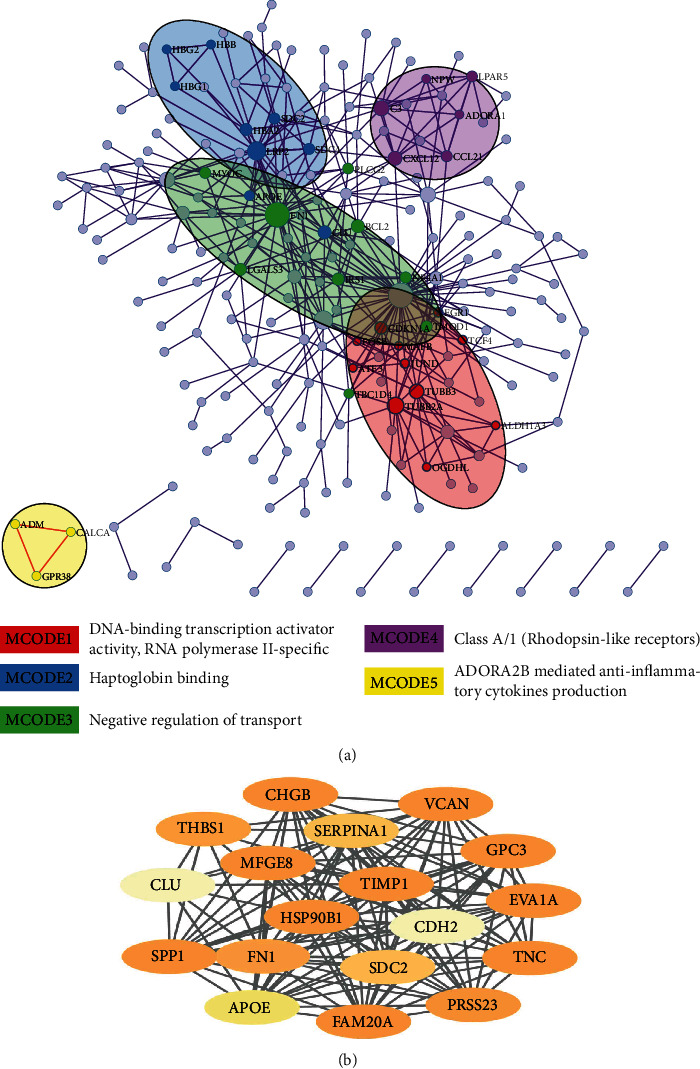
Figure 4.

MCODE enrichment analysis by Metascape. (a) PPI interaction network. The MCODE algorithm was applied to clustered enrichment ontology terms to identify neighborhoods where proteins are densely connected. Each MCODE network is assigned a unique color. GO enrichment analysis was applied to each MCODE network. See Supplementary Table S1 for more details. Red, blue, green, violet, and orange colors indicate modules 1, 2, 3, 4, and 5, respectively. (b) Additionally, 18 most significant genes of four models of MCC, degree, DMNC, and MNC were identified using the cytoHubba plugin in the Cytoscape.
