
Figure 4.
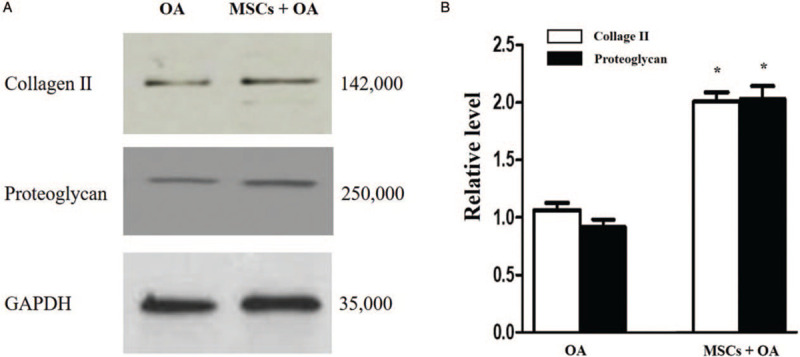
Relative quantitative detection of type II collagen and proteoglycan protein in two groups. (A) Western blotting results revealed the level of type II collagen and proteoglycan protein. (B) The relative levels of collagen II and proteoglycan in OA group and MSCs + OA group (∗P < 0.01 vs. the corresponding relative protein expression level in the OA group). GAPDH: Glyceraldehyde-3-phosphate dehydrogenase; MSCs: Mesenchymal stromal cells; OA: Osteoarthritis.