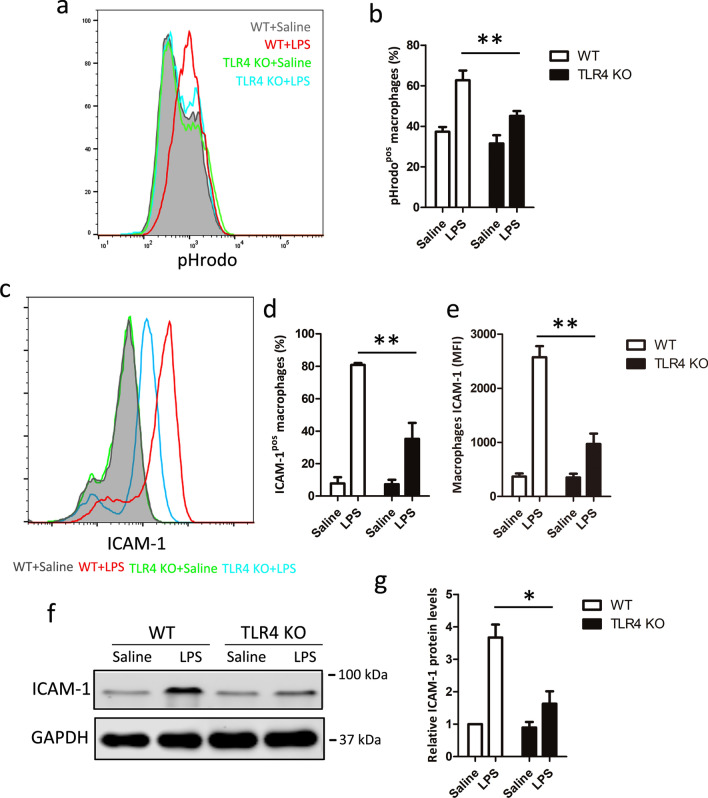
Fig. 4.
TLR4 regulates ICAM-1 expression upon LPS stimulation. LPS stimulated BMDM cells from WT and TLR4 knockout mice for 24 h. Macrophage phagocytosis and ICAM-1 cell surface expression were analyzed by flow cytometry. a Representative histogram illustrating the detection of pHrodo associated macrophages. b Percentage of pHrodo-positive (pHrodopos) macrophages is shown. c Representative histogram of ICAM-1 cell surface expression. d Percentage of ICAM-1-positive (ICAM-1pos) macrophages is shown. e Mean fluorescence intensity (MFI) is shown. f ICAM-1 total protein expression was measure by western blot. GAPDH was used as a loading control. g Quantification of ICAM-1 expression. Data shown represent three independent experiments, *P < 0.05, **P < 0.01

