
Figure 3.
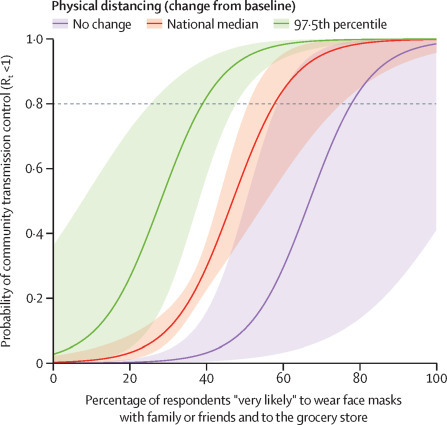
Mask wearing, physical distancing, and the predicted probability of Rt being less than 1
Projected values from a logistic regression model measuring the association of community transmission control (Rt<1) with mask-wearing and physical distancing in US states, adjusting for population density, percentage of respondents who were not White, and a time trend. Values of physical distancing were from the Google community reports of relative residential time and represent no change from baseline, the national median during the study period (June 3–July 31, 2020), and the 97·5th percentile observed during the study period. Observed mask-wearing was 8·1–73·7%, so estimates outside this range are model-based extrapolations. The horizontal line was placed at a 0·8 probability of community transmission control, though the desired percentage might be higher. Rt=instantaneous reproductive number.