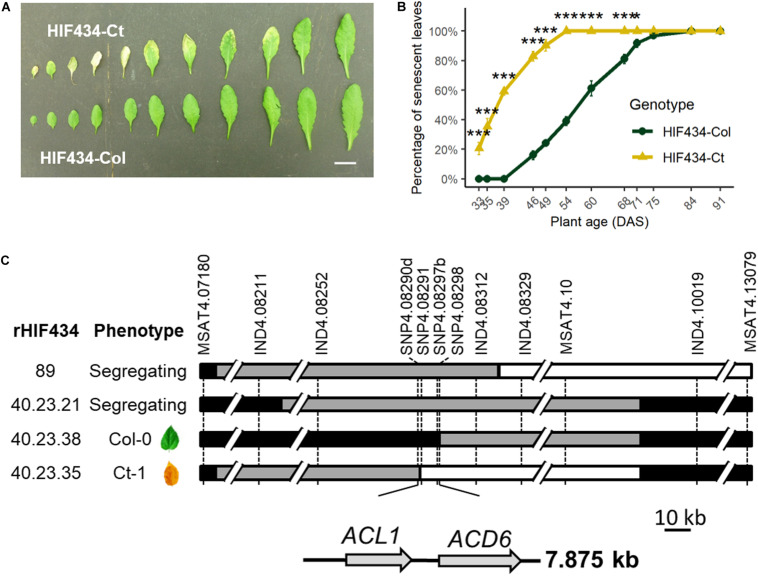
FIGURE 1.
Fine mapping of SEN.4 locus. (A) Rosette leaves (rank 4–14) of 7-week-old plants. Upper row: HIF434-Ct; lower row: HIF434-Col. Scale bar corresponds to 2 cm. (B) Percentage of senescent leaves in HIF434-Ct (yellow triangle line) and HIF434-Col (dark green circle line) during the reproductive phase. Flowering transition occurred on average at 23.6 days after sowing (DAS) for HIF434-Col and 24.6 DAS for HIF434-Ct. Stars indicate significant difference between the two genotypes (Student’s test, n = 12, *p < 0.05, ***p < 0.001). (C) The genotype of the most informative recombinants (rHIFs) used to delineate the final 7.875 kb candidate interval is represented with horizontal bars (black for Col-0 allele, white for Ct-1 allele, gray for heterozygous). Dashed vertical bars represent markers used for genotyping between 7.180 and 13.08 Mb on chromosome 4. The phenotype of each rHIF progeny is indicated (phenotype).

