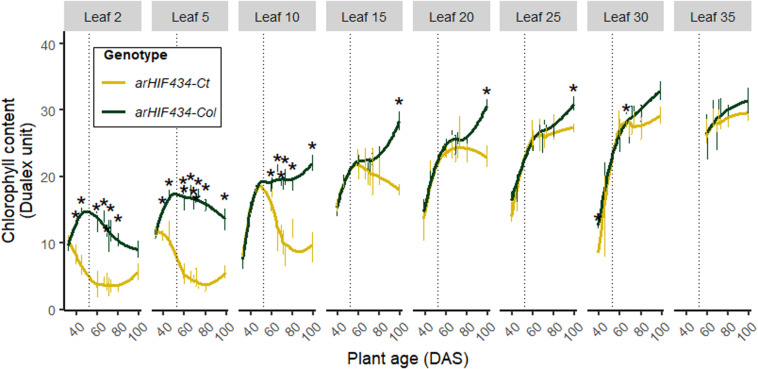
FIGURE 3.
ACD6 activity affects kinetics of chlorophyll content. Yellow and green colors indicate values for arHIH434-Ct and arHIF434-Col, respectively. Kinetics of chlorophyll content among several leaf ranks in the two arHIF434 genotypes. Points indicate the average of chlorophyll content (±SE). Stars indicate significant difference between the two genotypes (Student’s test, 4 ≤ n ≤ 8, p ≤ 0.05). Vertical dotted lines show the flower bud emergence at 52 days after sowing (DAS).

