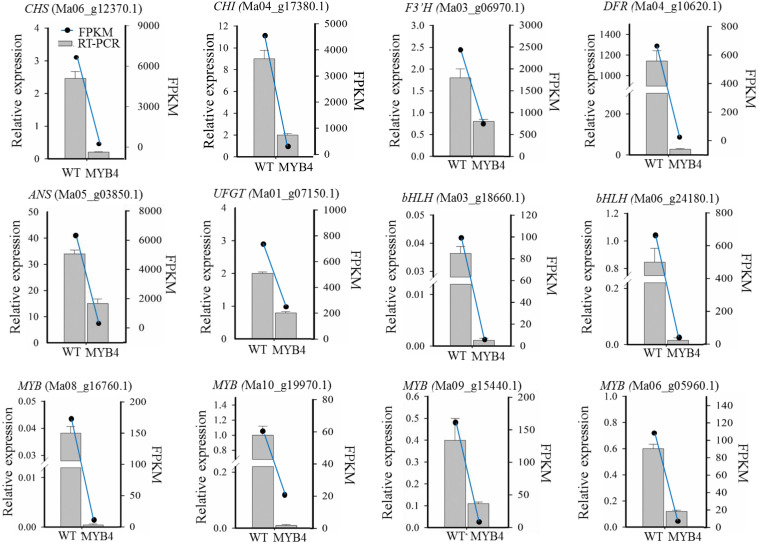
FIGURE 6.
Gene expression changes as assessed by RNA-Seq and RT-qPCR. The labels in parentheses were representative genes involved in anthocyanin synthesis. The relative expression, detected by RT-qPCR, was represented by a bar graph, and the left ordinate indicates the expression level. FPKM of gene, according to RNA-Seq data, was represented by a line graph, and the right ordinate indicates the FPKM level.

