FIGURE 2.
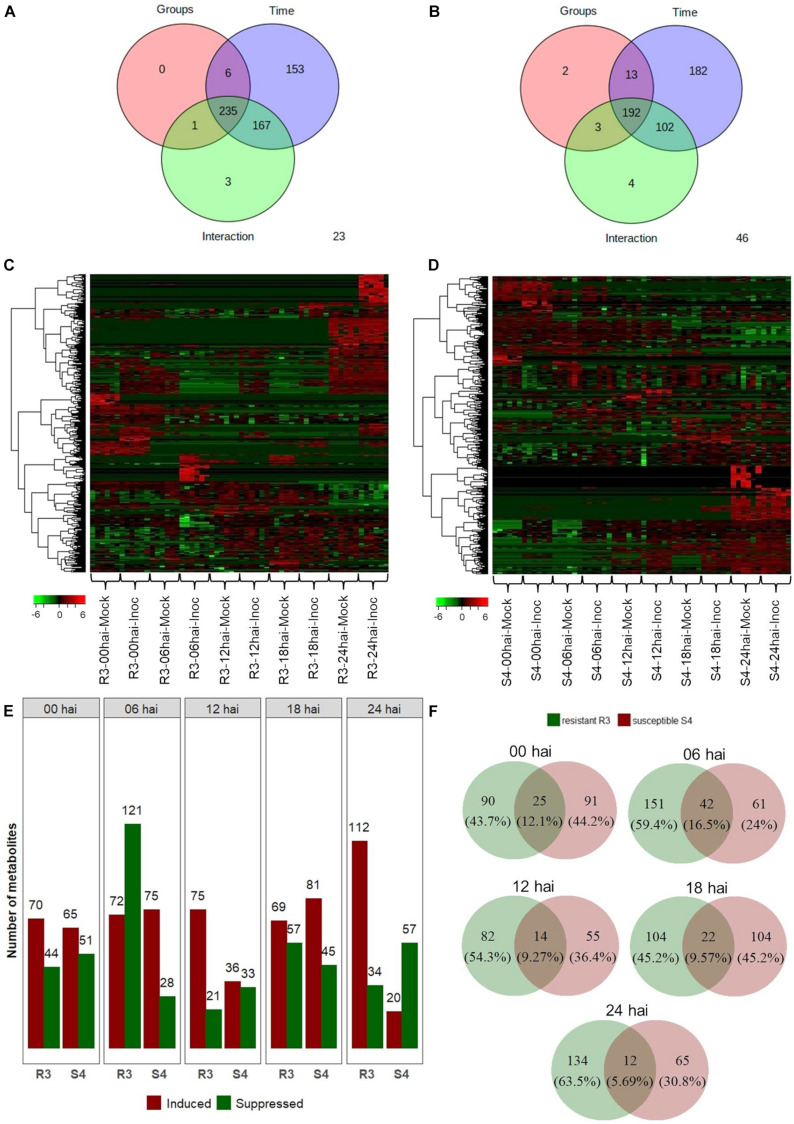
Two-way ANOVA for 709 metabolite features obtained from “groups” (inoculated and mock-inoculated plants) and “time” (00, 06, 12, 18, and 24 hai time-points) treatments of the resistant-R3 and susceptible-S4 genotypes of E. grandis in response to rust infection. Venn diagrams showing the number of significant features for “groups,” “time,” and “groups vs. time interaction” effects: (A) resistant-R3 and (B) susceptible-S4 genotypes. Heatmaps of significant features: (C) resistant-R3 and (D) susceptible-S4 genotypes. (E) The number of differential metabolite features of the resistant R3 and suceptible-S4 genotypes by contrasting inoculated and mock-inoculated groups within each time-point by t-test. Bars in green indicate down-regulated metabolites and bars in red represent up-regulated metabolites. (F) Venn diagrams of differential metabolite features in contrasting genotypes at each time-point considered. Green circles represent the resistant-R3 genotype and red circles represent the susceptible-S4 genotype. Results of statistical analyses were considered significant when FDR-adjusted p < 0.05.

