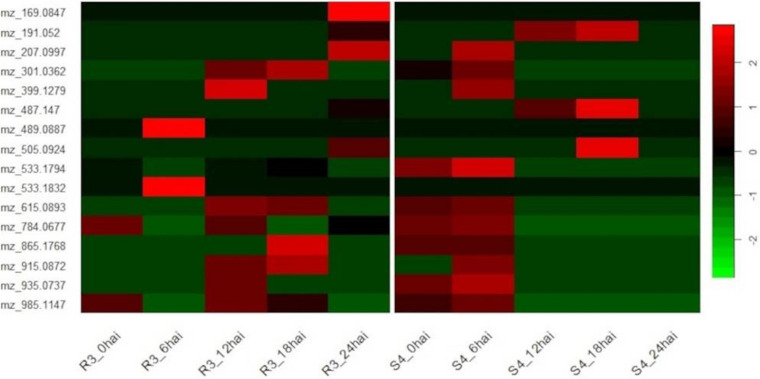
FIGURE 4.
Heatmap of genotype-specific (resistant-R3 and susceptible-S4) time-course for 16 metabolites selected by ASCA (ANOVA simultaneous component analysis) producing prominent effects for “genotype vs. time-point” interactions and MEBA (multivariate empirical Bayes analysis) to rank features, and evaluated by MS/MS analysis.

