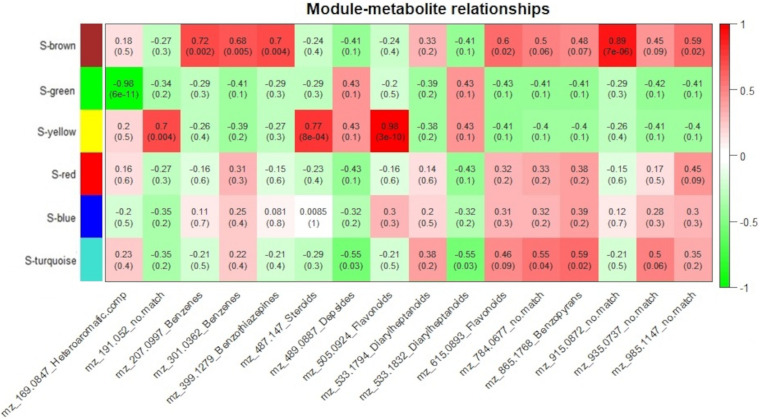
FIGURE 7.
Susceptible-S4 correlation analysis of protein modules and selected metabolites. Protein modules are represented by colors at the left side and selected metabolites are represented by their m/z and chemical classes at the bottom. Correlation values and p-values are present inside the rectangles. Red and green colors indicate positive and negative correlations, respectively. Correlations were considered significant when p < 0.05.

