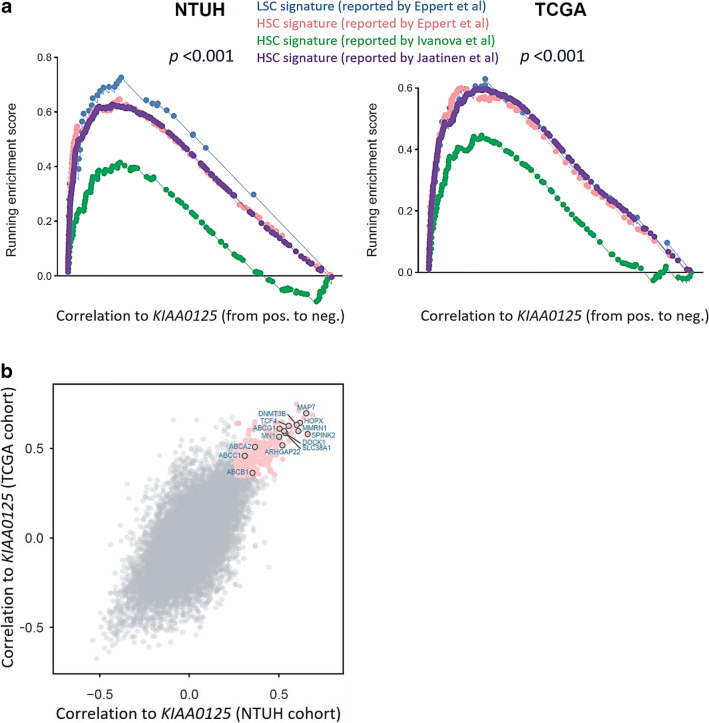
Fig. 3.
GSEA enrichment plots of HSC and LSC signatures and scatter plot of genes positively associated with higher KIAA0125 expression. a GSEA enrichment plots show positive association of higher KIAA0125 expression with HSC and LSC signatures curated from several published reports in both the NTUH and TCGA cohorts; b the scatter plot reveals the genes strongly correlated to KIAA0125 expression in both the NTUH and TCGA cohorts (pink). The correlation measurement is based on the Spearman’s correlation coefficient between the given gene and KIAA0125. The strongly correlated genes are defined as their correlation values at top 5% of all genes in both cohorts

