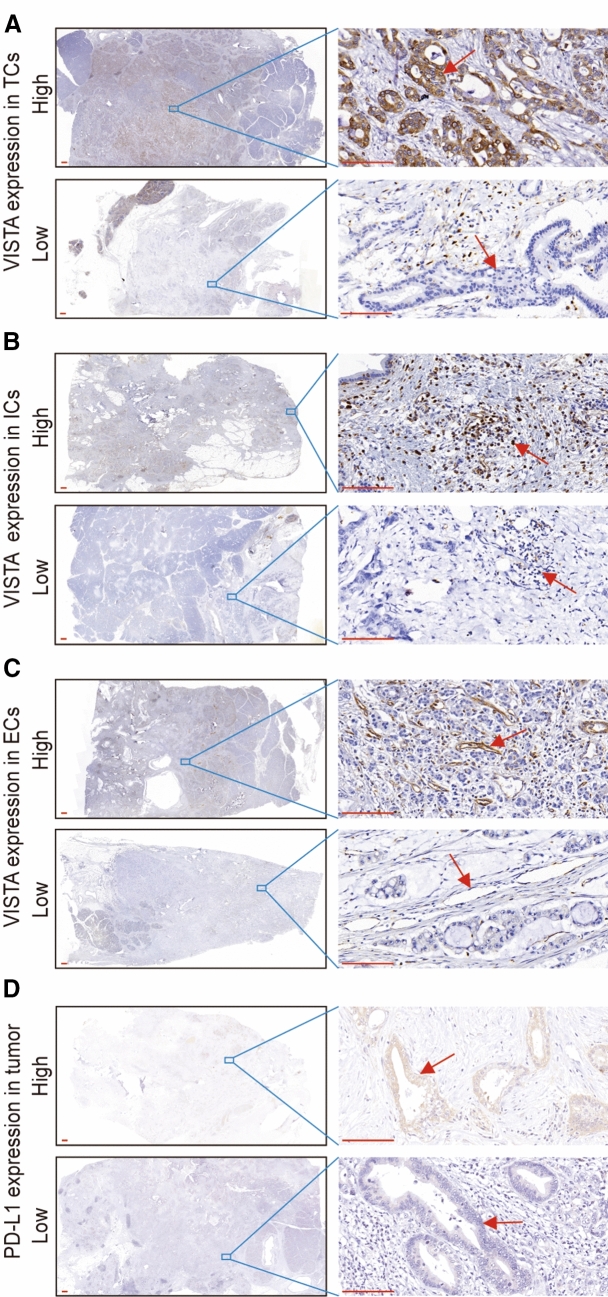
Fig. 1.
Immunohistochemical staining of VISTA and PD-L1 in human PDAC. Human PDAC tissue samples were stained with anti-VISTA and anti-PD-L1 antibodies. Low magnification (10×) and high magnification (400×) images were obtained. Scale bar = 50 μm (red line at the bottom left). a VISTA expression in tumor cells (TCs). The red arrows indicate VISTA-positive or VISTA-negative TCs. b VISTA expression in immune cells (ICs). The red arrows indicate VISTA-positive or VISTA-negative ICs. c VISTA expression in endothelial cells (ECs). The red arrows indicate VISTA-positive or VISTA-negative ECs. d PD-L1 expression in TCs. The red arrows indicate PD-L1-positive or PD-L1-negative TCs

