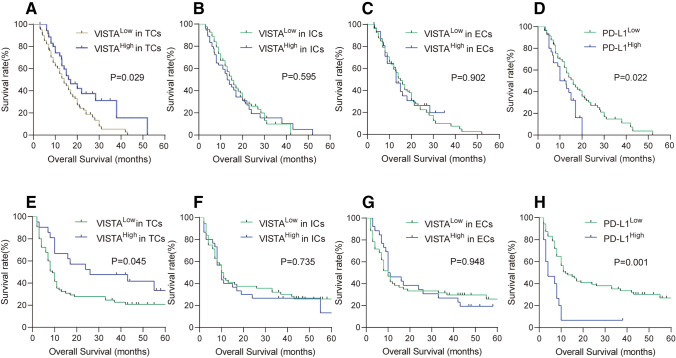
Fig. 2.
Kaplan–Meier analysis of OS of PDAC patients from cohort #1(a–d) and cohort #2(e–h) according to VISTA and PD-L1 expressions. (a, e) Kaplan–Meier plot of OS in cohort #1 and cohort #2 according to VISTA expression in TCs. (b, f) Kaplan–Meier plot of OS in cohort #1 and cohort #2 according to VISTA expression in ICs. (c, g) Kaplan–Meier plot of OS in cohort #1 and cohort #2 according to VISTA expression in ECs. (d, h) Kaplan–Meier plot of OS in cohort #1 and cohort #2 with high or low tumor expression of PD-L1

