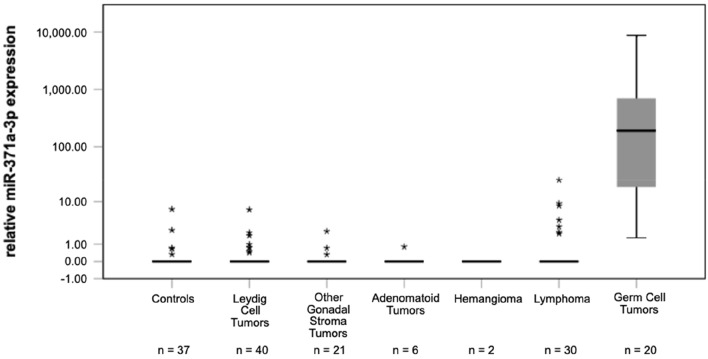
Fig. 2.
Relative M371 expression in serum of controls, testicular germ cell tumors and in various benign testicular tumours of non-germ origin. Boxplots indicate the median relative M371 expression with interquartile ranges. The subgroup of other gonadal stroma tumours includes Sertoli cell tumours (n = 18), Granulosa cell tumours (n = 2) and one unspecified gonadal stroma tumour. Statistical outliers are represented by stars. The median M371 expression of germ cell tumours is significantly higher than that of controls and of each of the other subgroups, respectively (***p < 0.001). The y-axis is plotted in a logarithmic scale

