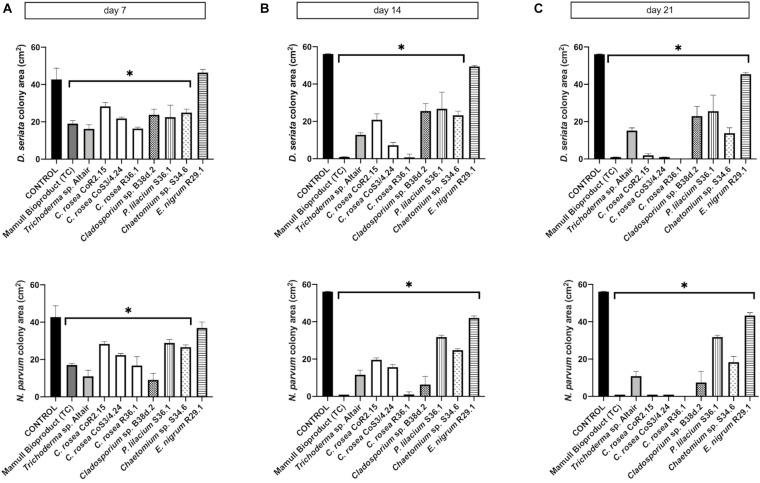
FIGURE 5.
Colony area measured after (A) 7, (B) 14, and (C) 21 days of inoculation of D. seriata (top row) and N. parvum (bottom row), when growing alone (control) or in co-culture with the antagonists in PA. Bars with asterisk are significantly different to the control (Tukey’s test, P < 0.001). Error bars represent the standard error of the mean, n = 5.

