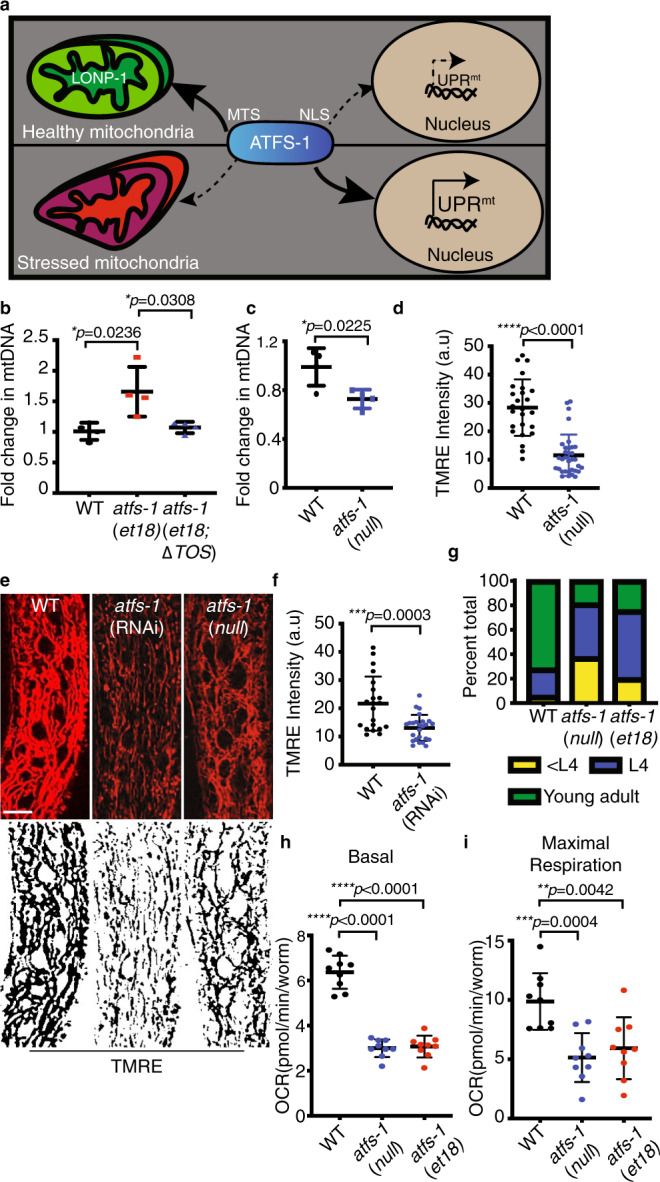
Fig. 1. ATFS-1 regulates mitochondrial network expansion.

a Schematic of ATFS-1 regulation. b Quantification of mtDNA in wild type, atfs-1(et18), and atfs-1(et18;ΔTOS) as determined by qPCR. N = 4 biologically independent experiments. Error bars mean ± SD (two-tailed Student’s t-test). c Quantification of mtDNA in wild type and atfs-1(null). N = 4 biologically independent experiments. Error bars mean ± SD (two-tailed Student’s t-test). d Quantification of TMRE intensity in the intestine of wild-type and atfs-1(null) worms. Experiments were repeated three biologically independent times with similar results. N = 21 worms (wild type), N = 33 worms ((atfs-1(null)). Error bars mean ± SD (two-tailed Student’s t-test). a.u. arbitrary units. e TMRE staining of wild-type worms raised on control or atfs-1(RNAi) and atfs-1(null) worms. Skeleton-like binary backbone is presented (bottom). Experiments were repeated three biologically independent times with similar results. N = 21 worms. Scale bar 10 µm. f Quantification of TMRE intensity in the intestine of wild-type and atfs-1(RNAi) worms. Experiments were repeated three biologically independent times with similar results. N = 25 worms. Error bars mean ± SD (two-tailed Student’s t-test). a.u. Arbitrary units. g Developmental stages of 3-day-old wild-type, atfs-1(et18), or atfs-1(null) worms. N = 546 worms(wild type), N = 597 worms (atfs-1(et18)) and 627 worms (atfs-1(null)). Experiments were repeated two biologically independent times with similar results. h, i Oxygen consumption rates (OCR) in wild type, atfs-1(et18), and atfs-1(null). Basal respiration (h), maximal respiration (i). N = 9 wells each containing ten worms. Error bars mean ± SD (two-tailed Student’s t-test). Experiment was performed three biologically independent times with similar results. Source data are provided as a Source Data file.
