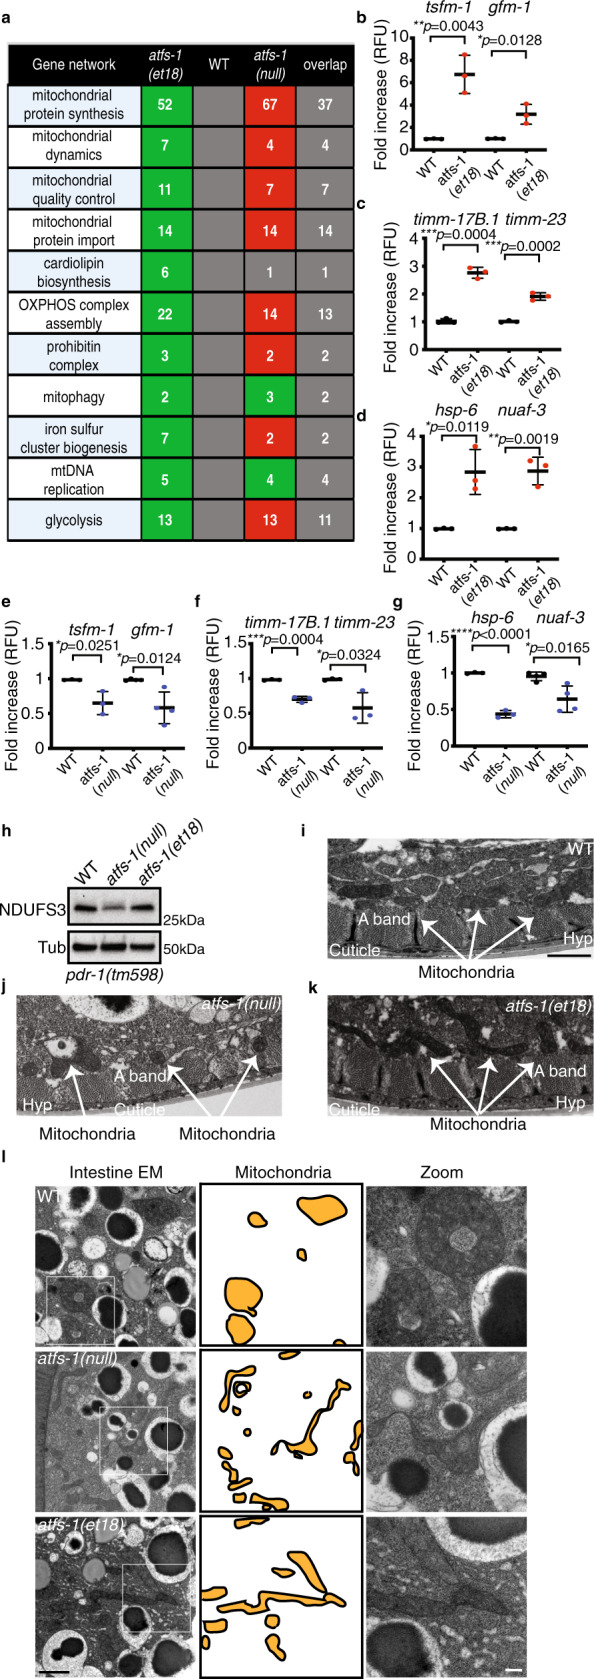
Fig. 2. ATFS-1 mediates a mitochondrial network expansion program.

a Number of differentially regulated genes induced in atfs-1(et18) worms relative to wild type (WT) or reduce in atfs-1(null) worms relative to wild type. Green, upregulated; red, downregulated; and the number of overlapping genes between atfs-1(et18) and atfs-1(null) worms are listed in the last column. b–g Transcript levels of translation elongation factor mitochondrial 1 (tsfm-1) and G elongation factor mitochondrial 1 (gfm-1) (b, e), translocase of inner mitochondrial membrane 17B.1 (timm-17B.1) and translocase of inner mitochondrial membrane-23 (timm-23) (c, f), heat shock protein-6 (hsp-6) and NADH:ubiquinone oxidoreductase complex assembly factor 3 (nuaf-3) (d, g) as determined by qRT-PCR in wild type and atfs-1(et18) (b–d) or in wild type and atfs-1(null) (e–g). N = 3 biologically independent experiments except for gfm-1 (e) and nuaf-3 (g) N = 4. Error bars mean ± SD (two-tailed Student’s t-test). RFU, relative fluorescence units. h SDS-PAGE immunoblots of lysates from pdr-1(tm598), atfs-1(null);pdr-1(tm598), and atfs-1(et18);pdr-1(tm598) worms. NDUFS3 is a component of the NADH:Ubiquinone Oxidoreductase complex I and tubulin (Tub) was used as a loading control. N = 3 biologically independent experiments with similar results. i–k. Transmission electron microscopy of body wall muscle of wild type (i), atfs-1(null) (j), and atfs-1(et18) worms (k). Scale bar 1 µm. Representative images from five worms analyzed from two biologically independent experiments with similar results. l Transmission electron microscopy of intestinal cells from wild-type, atfs-1(null), and atfs-1(et18) worms. Mitochondria are highlighted in the middle panel. Scale bar 1 µm (left) and 200 nm (right). Representative images from five worms analyzed from two biologically independent experiments with similar results. Source data are provided as a Source Data file.
