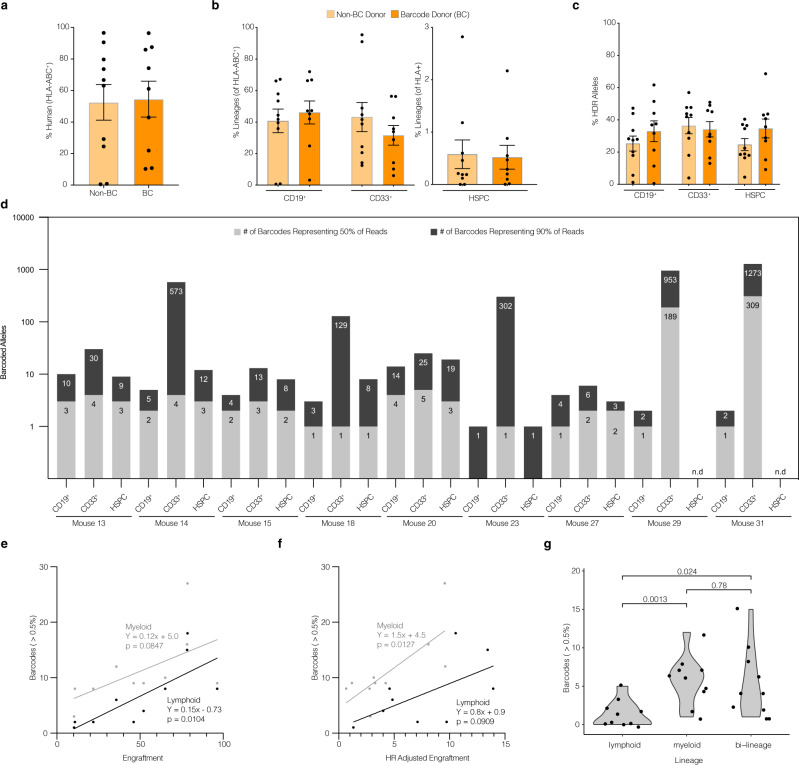
Fig. 3. TRACE-Seq identifies lineage-restricted and multi-potent gene-targeted HSPCs in primary NSG transplants.
CD34+ enriched cord blood-derived HSPCs were cultured in HSPC media containing SCF, FLT3L, TPO, IL-6, and UM-171 for 48 h, electroporated with Cas9 RNP (HBB sgRNA), transduced with AAV6 donors (either BC or non-BC), and cultured for an additional 48 h prior to intrafemoral transplant into sublethally irradiated NSG mice (total manufacturing time was less than 96 h). A total of 16–18 weeks post-transplantation, total BM was collected and analyzed for engraftment by flow cytometry, sorted on lineage markers, and sequenced for unique barcodes. Two independent experiments were performed to assess reproducibility of identifying clonality of gene-targeted HSPCs. a Total human engraftment in whole bone marrow, (as measured by the proportion of human HLA-ABC+ cells). b Multilineage engraftment of human CD19+, CD33+, and HSPCs (CD19−CD33−CD10−CD34+). c Genome editing efficiency in each indicated sorted human lineage subset as determined by NGS (HR reads/[all reads]). d Barcodes from each subset were sorted from largest to smallest by percentage of reads. Depicted are the numbers of most abundant, unique barcode alleles comprising the top 50% and top 90% of reads from each lineage of all mice transplanted with BC donor edited HSPCs. Mean ± SEM genomes analyzed from each group: CD19+: 8500 ± 1000, CD33+: 8800 ± 800, HSPC: 1500 ± 500 (see Supplementary Table 4). e Correlation between numbers of high confidence barcodes (>0.5%) in lymphoid (gray) and myeloid (black) compartments and total human engraftment (as percent of human and mouse BM-MNCs). Lymphoid and myeloid values plotted for n = 9 primary engrafted mice and n = 1 secondary engrafted mouse. f Correlation between numbers of high confidence barcodes (>0.5%) in lymphoid (gray) and myeloid (black) compartments and HR adjusted engraftment ([human engraftment] x [lineage specific engraftment] x [HR efficiency]). Lymphoid and myeloid values plotted for n = 9 primary engrafted mice and n = 1 secondary engrafted mouse. g Numbers of high confidence barcodes from each mouse which contribute to lymphoid only (CD19+), myeloid only (CD33+), or both lineages. High confidence barcodes: barcodes with at least 0.5% representation (see Supplementary Fig. 1). All points represent individual mice (n = 9 non-BC treated and n = 10 BC treated biologically independent mice in one independent experiment), with the exception of panels e–g (where barcodes from each mouse are separated based on lineage contribution). Error bars depict mean ± SEM. p values reflect 2-tailed t-test.

