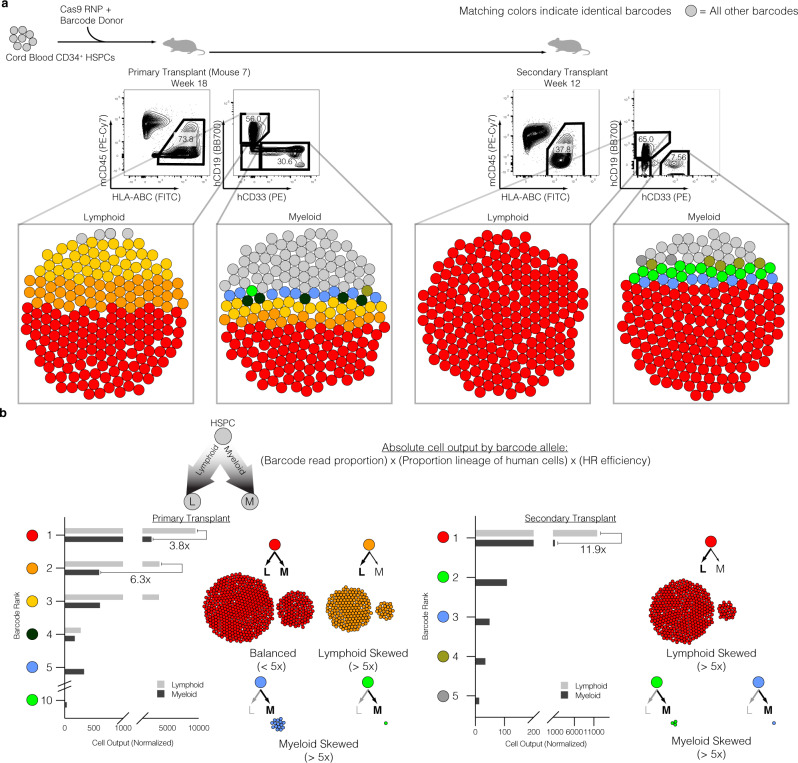
Fig. 5. Clonal tracking of AAVS1 barcoded targeted HSPCs in reconstituting primary and secondary NSG transplants.
a Top: Experimental schematic. Middle: Flow cytometry plots representing bi-lineage engraftment in primary transplant (left, week 18 post-transplant) and secondary transplant (right, week 12 post-transplant). Bottom: Bubble plots representing barcode alleles as unique colors from each indicated sorted population. Shown are the three most abundant clones from all six populations. All other barcodes represented as gray bubbles. b Normalized output of barcode alleles with respect to lineage contribution. Total cell output (bar graphs) from indicated barcodes adjusted for both differential lineage output and genome editing efficiency within each subset. Examples of various lineage skewing depicted, with cell counts reflecting relative contributions to the xenograft. One highly engrafted mouse (Mouse 7) depicted of n = 5 total. Skewed output defined as 5-fold or greater bias in absolute cell counts towards lymphoid or myeloid lineages.

