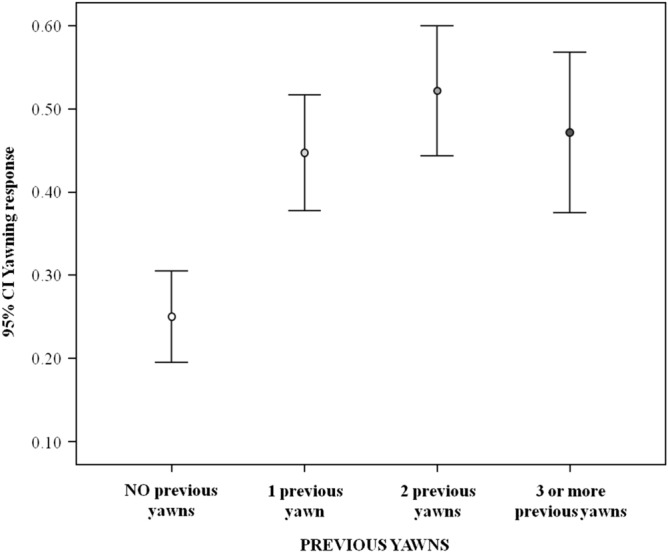
Figure 3.

Error bars (mean, 95% confidence interval) showing the occurrence of the yawning response (Y axis) as a function of the number of additional yawns emitted by subjects other than the yawn emitted by the last trigger (X axis). The variable has a significant main effect on the yawning response (results of Model1 included in Table 1), with the response being highest when one or more additional yawn had been emitted compared to no additional yawn (Tukey post-hoc test with Bonferroni correction; no additional yawn versus other conditions: 0.001 < p ≤ 0.045. CI confidence interval.
