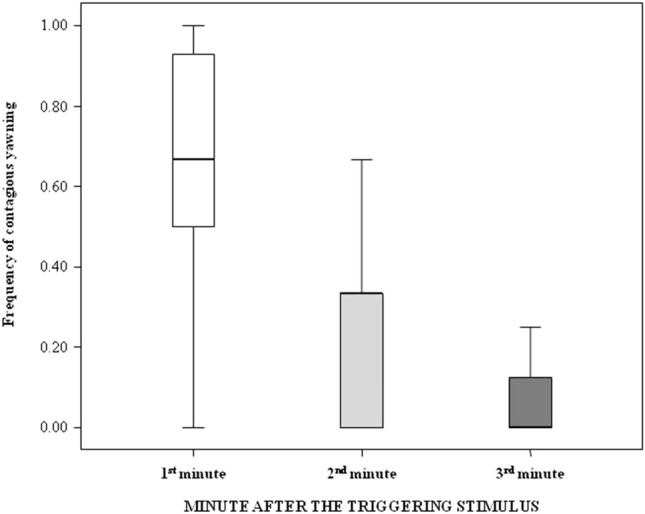
Figure 4.

Box-plot showing the frequency of contagious yawning (Y axis) as a function of the minutes elapsing after the triggering stimulus (X axis). The difference across minutes is significant (Friedman’s test; N = 19, χ2 = 19.279, df = 2, p < 0.001), with yawn contagion being significantly higher in the first minute than in other minutes (pairwise comparisons via Bonferroni–Dunn post-hoc test; first versus other minutes, 0.001 ≤ p ≤ 0.045). Solid horizontal lines indicate medians, length of the boxes corresponds to inter-quartile range and thin horizontal lines indicate minimum and maximum of the observed values.
