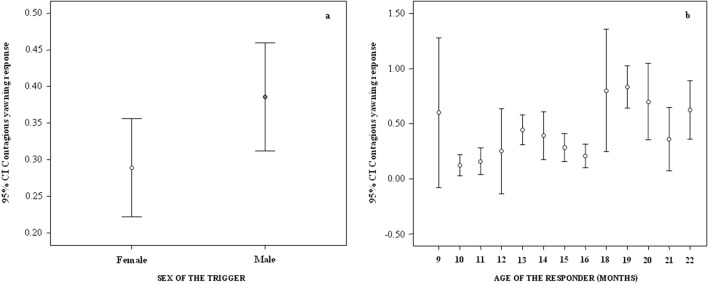
Figure 6.
Error bars (mean, 95% confidence interval) showing the occurrence of yawn contagion (Y axis) as a function of individual factors (X axis): sex of the trigger (a) and age of the responder (b). Both variables have a significant main effect on yawn contagion (results of Model2 included in Table 2) with (a) yawn contagion being highest when the trigger was a male and (b) linearly increasing with age (bivariate correlation via randomization: n = 13, r = 0.600, p = 0.031). CI confidence interval.

