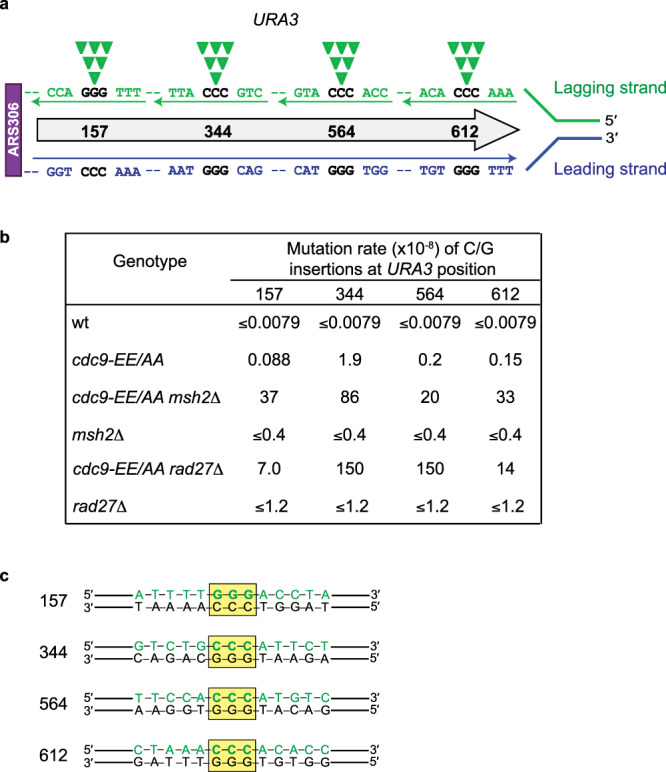
Fig. 2. Analysis of mutational hotspots for +1 insertions in the low-fidelity cdc9-EE/AA strain +/− MSH2 or RAD27.

a A schematic of the URA3 reporter gene located adjacent to the ARS306 replication origin. Displayed is the leading strand DNA sequence synthesized by Pol ε in blue and the lagging strand synthesized by Pol δ in green. The additional C that would be incorporated by Pol δ at three of the mutation hotspots to generate a +1 insertion is indicated by the closed green inverted triangles. b Site-specific rates for +1 G/C insertions at 4 hotspots in the URA3 reporter gene for the wt and cdc9-EE/AA strains +/− MSH2 or RAD27. Rates were calculated as the proportion of each site-specific event among the total mutants sequenced (Supplementary Table 3) multiplied by the overall mutation rate (Fig. 1c). c A depiction of the DNA sequences surrounding four of the sites in URA3 at which the mutation rate of +1 insertions of G/C is the highest. The Pol δ-synthesized lagging strand is shown in green and the location of the homopolymer run in which an extra base would be inserted is highlighted by the yellow box.
