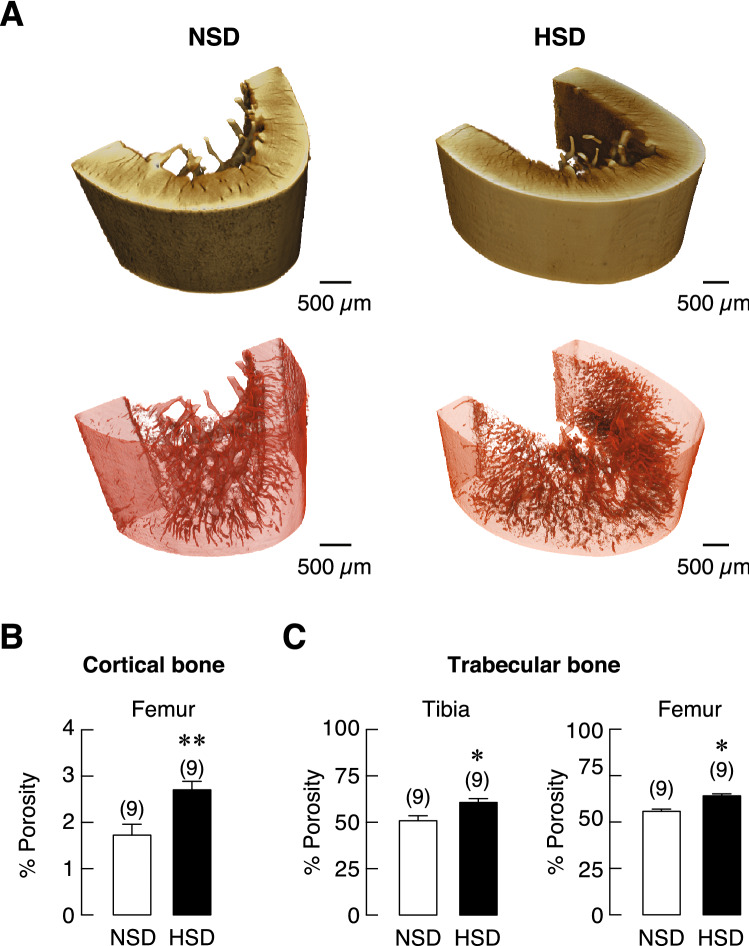
Figure 5.
The segmentation and analysis for pore measurement in the 3D volumes of cortical bone specimens obtained from SRXTM. (A) 3D volume representatives of the cortical bone at diaphysis of femur from NSD and HSD group are shown in brown color gradient. The segmentation of pore canals inside the bones is rendered in red color enclosed with a transparent background for porosity measurement. All scale bars are depicted 500 µm. (B) quantitative analyses of the porosity of cortical bone at diaphysis of femurs and (C) trabecular bone at proximal metaphysis of tibiae and trabecular bone at distal metaphysis of femurs. The number of animals in each group are indicated in parentheses. *P < 0.05, **P < 0.01 compared to NSD.

