
Fig. 4. MOTS-c regulates aging metabolism and healthspan.
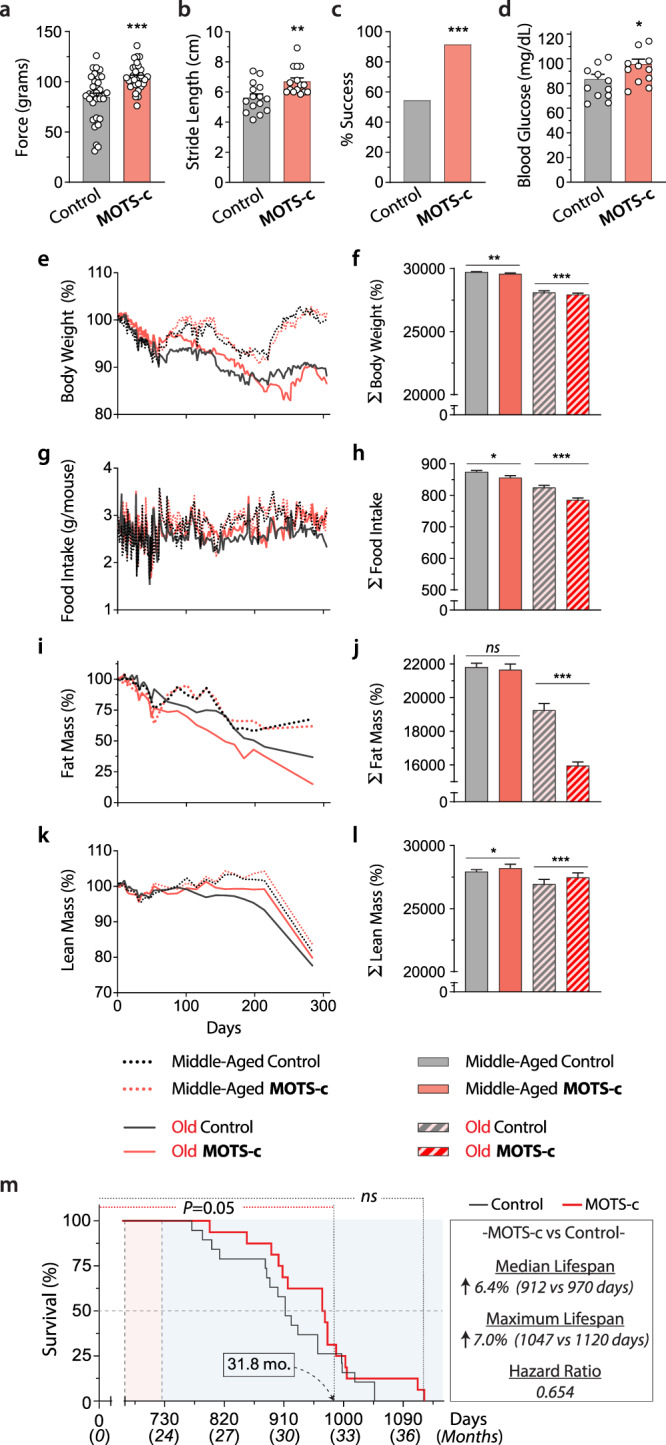
Life-long measurements on male C57BL6/N mice treated intermittently (3x/week) with MOTS-c (15 mg/kg/day) starting at middle and old age (13.5 and 23.5 mo.) as described in Fig. 2a. a grip strength test (n = 11; run in triplicate; P = 0.000078), b gait analysis (stride length; n = 5; run in triplicate; P = 0.0038), c 60-s walking test (n = 11, control; n = 12, MOTS-c; P = 0.0428), and d blood glucose levels (n = 11; P = 0.0397). e, f Body weight e as a function of time and f the total sum (∑; n = 19, old control; n = 18, old MOTS-c; P = 0.0013, MA control vs. MA MOTS-c; P = 0.001, old control vs. old MOTS-c); g, h Food intake g as a function of time and h the total sum (∑; n = 19, old control; n = 18, old MOTS-c; P = 0.0276, MA control vs. MA MOTS-c; P = 0.00005, old control vs. old MOTS-c); i, j Percent fat mass i as a function of time and j the total sum (∑; n = 19, old control; n = 18, old MOTS-c; P < 1E-50); k, l Percent lean mass k as a function of time and l the total sum (∑; P = 0.026, MA control vs. MA MOTS-c; P = 0.0003, old control vs. old MOTS-c). m Lifespan curve; P = 0.05 until 31.8 months of age. Overall curve trended towards increased median and maximum lifespan (P = 0.23). Data expressed as mean ± SEM. Log-rank (Mantel–Cox) test was used for m. Otherwise, all statistics were performed using the two-sided Student’s t test. *P < 0.05, **P < 0.01, ***P < 0.001. MA middle-age.