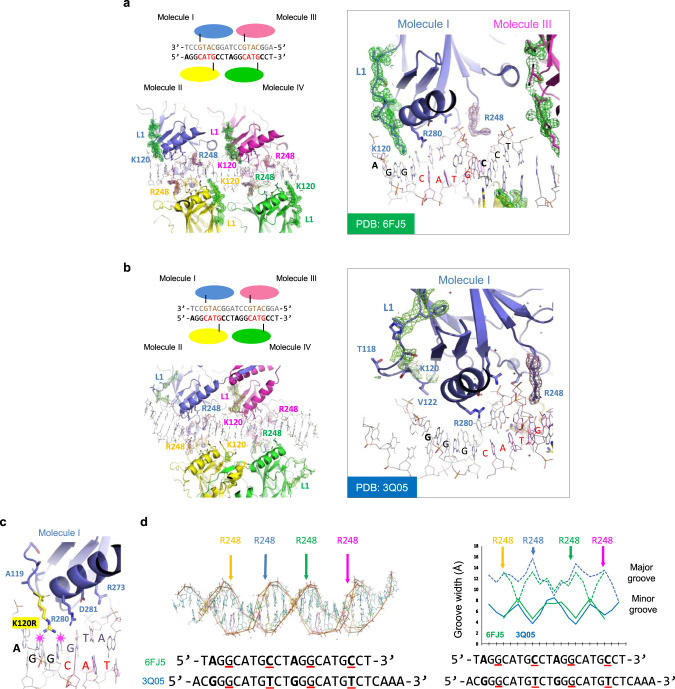
Fig. 3. Structural analysis of p53 in complex with distinct REs.
a, b Binding modes of p53 in complex with low-affinity, K120R-unbound (a) and high-affinity, K120R-bound RE (b). Top left: schematic representation of tetrameric p53 and DNA interactions. The CWWG core motifs are highlighted in red or gold. The four Arg280 residues of tetrameric p53 (molecules I to IV) that interact with guanine of the CWWG core regions are marked as black lines. DNA sequence differences between 6FJ523 (a) and 3Q0514 (b) are shown in bold (positions 1, 8, 11, and 18). Lower left: overview of the p53 structure in complex with the respective RE. The 2Fo–Fc electron density map contoured at 1σ above the mean is shown for the L1 loops in green and for the Arg248 residues in brown. Right: detailed view of molecule I-DNA interactions. c Modeling the Lys120 to Arg (K120R) mutation in the binding mode of low-affinity, K120R-unbound REs suggests steric clashes, indicated by pink stars with two guanine bases at positions 2 and 3. d Left: superimposition of the DNAs of 6FJ5 (green) and 3Q05 (blue). Arrows indicate significant differences between the two DNA structures and the approximate positions of the Arg248 residues colored as in a and b sensing the minor groove width. The aligned sequences are shown on the bottom, with differences in the 20-bp regions highlighted in bold, and positions 3, 8, 13, and 18 underlined in red. Right: width of major (dashed) and minor grooves (solid) calculated by the program 3DNA47,48. The plotted points correspond to positions between bps. Source data are provided as a Source Data file.

