
Fig. 1.
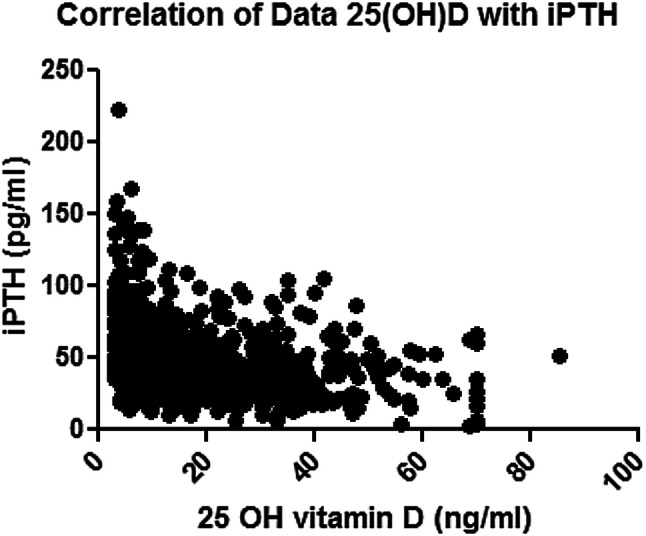
Scatter diagram depicting the inverse correlation between serum 25 (OH) D (on the X axis) and serum iPTH (on the Y axis)
Official websites use .gov
A
.gov website belongs to an official
government organization in the United States.
Secure .gov websites use HTTPS
A lock (
) or https:// means you've safely
connected to the .gov website. Share sensitive
information only on official, secure websites.
Scatter diagram depicting the inverse correlation between serum 25 (OH) D (on the X axis) and serum iPTH (on the Y axis)