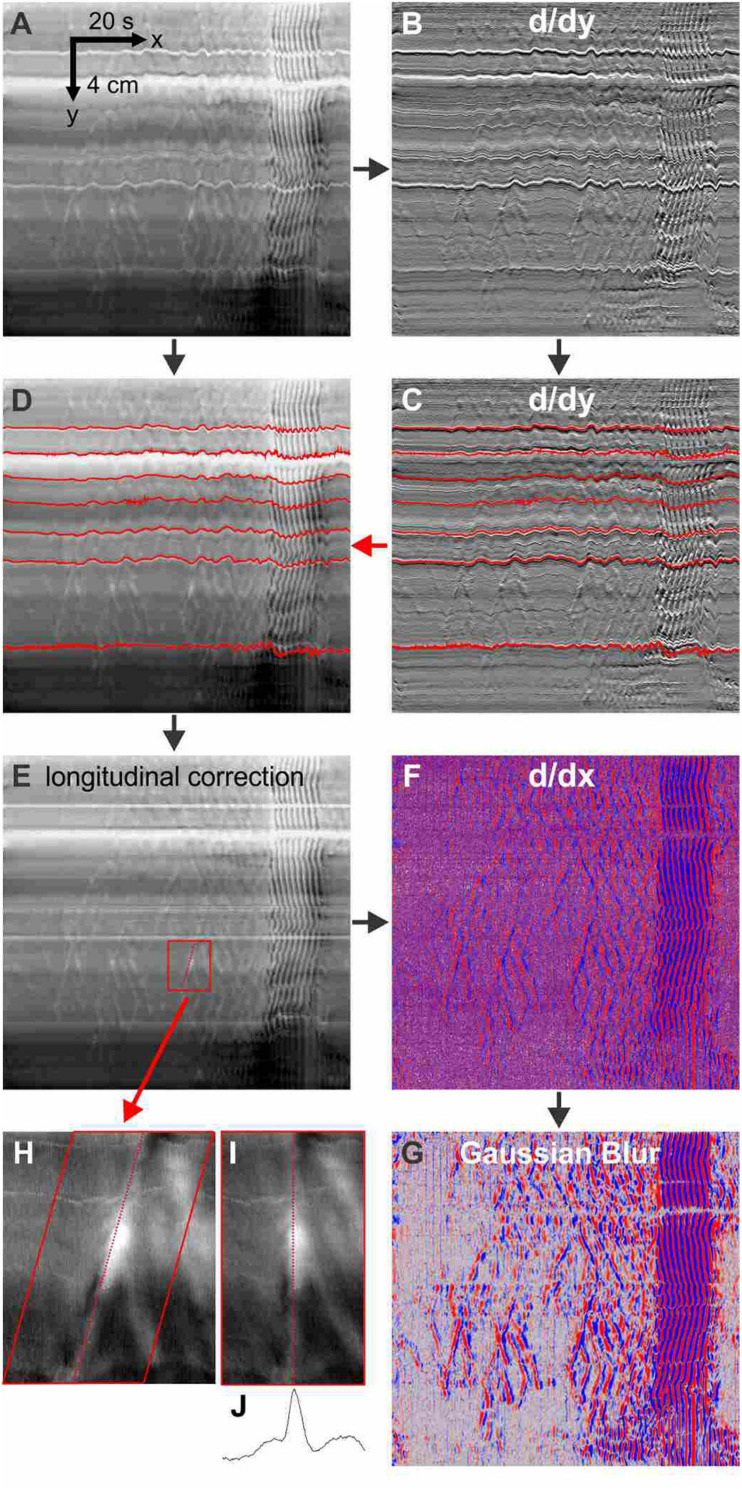
FIGURE 1.
Methodology. The processing of DMaps to highlight relaxation waves. Horizontal stripes in the DMap (A), resulting from tonic differences in intestine diameter such as Peyer’s patches and uncut mesentery, are accentuated by differentiation along the spatial/y axis (B). The wiggling up and down of the stripes represents longitudinal movement of the intestine. The stripes are tracked by a least-difference algorithm (C, red lines) and applied to the original DMap (D) to correct for longitudinal movement (E) by equalizing over time the distance between any two stripes. The longitudinal-corrected DMap is differentiated along its time/x axis (F) - reds are positive derivatives (relaxation) and blue are negative derivatives (contraction). This is convolved with a 4 pixel-width Gaussian blur filter (G). A region from the longitudinal-corrected DMap (H) is shear transformed so that the axis of the relaxation wave is realigned vertically (I). The spatial average of the realigned image (J) gives a diameter profile of the wave. For differentiation we used the FeatureJ plugin package of ImageJ. The Gaussian blur is a standard routine in ImageJ. Stripe tracking, longitudinal correction and wave realignment were custom ImageJ plugins.

