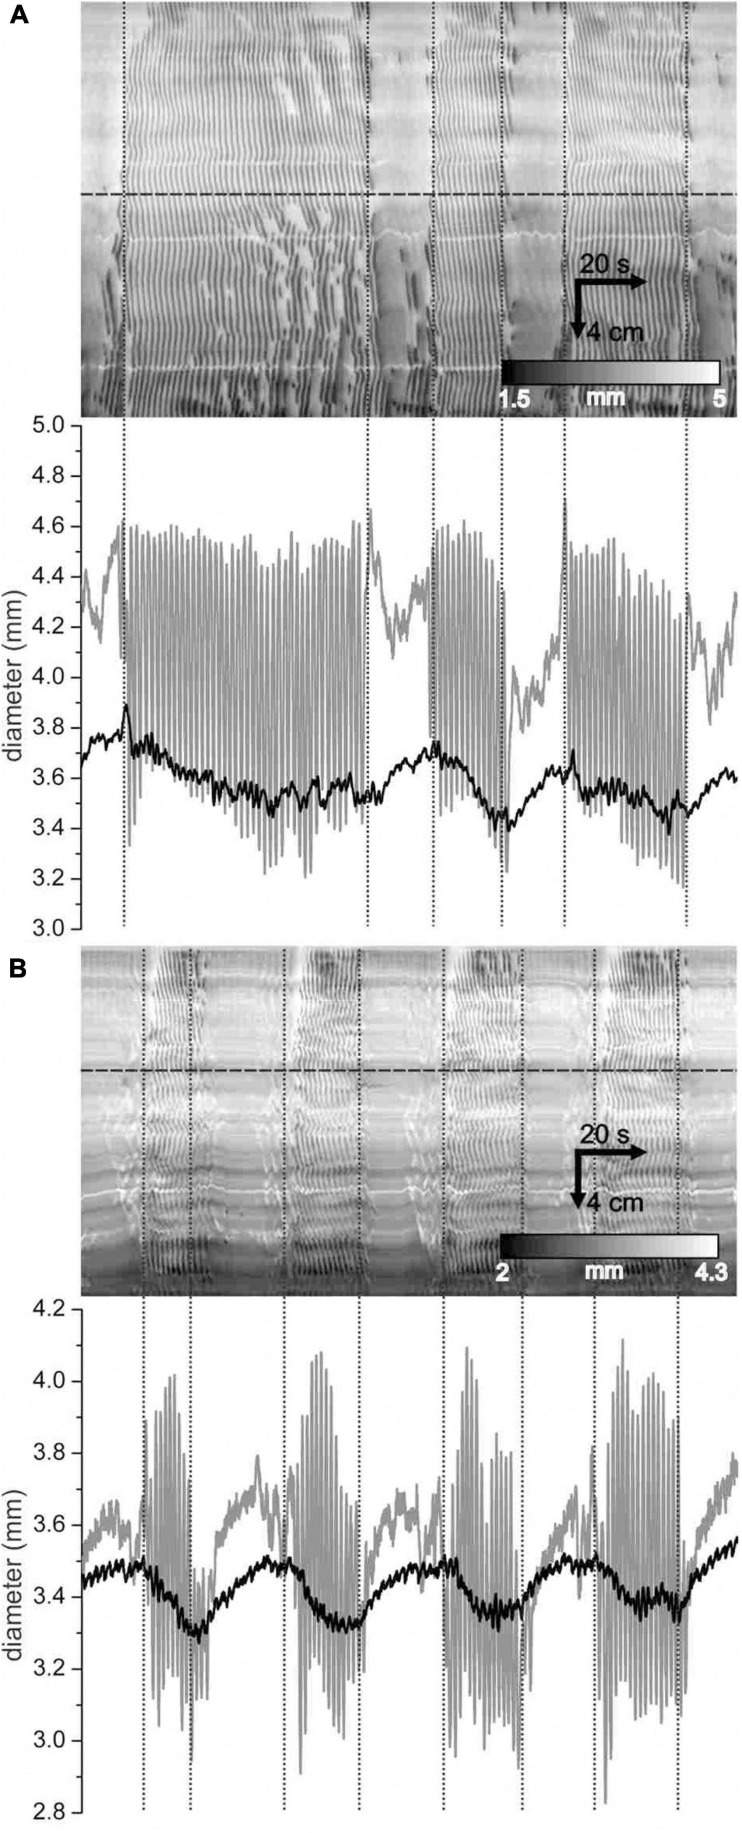
FIGURE 10.
Distension of the intestine during gaps. (A,B) DMaps (top) and their mean diameter (bottom, black) for two different intestines under control conditions (A) and with 1 μ M SNP (B). Diameter refers to the mean diameter across the whole extent of the intestine. Vertical dotted lines indicate cluster boundaries. At horizontal lines, a diameter map was created (bottom, gray).

