FIGURE 2.
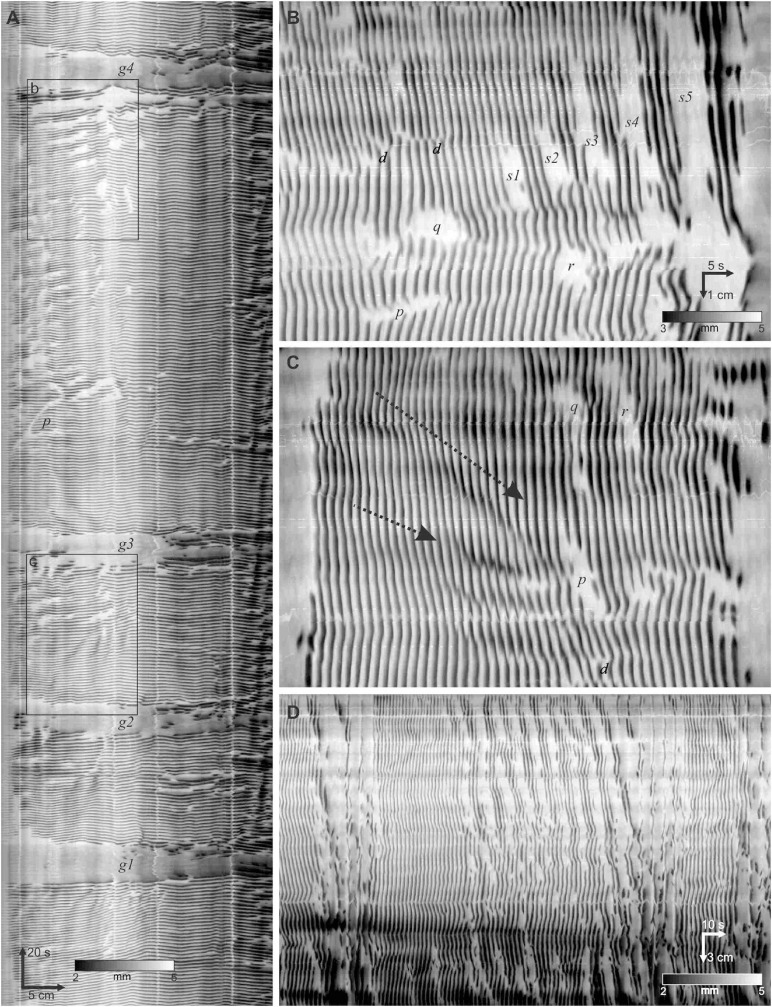
Contraction clusters and other phenomena in the luminally perfused murine small intestine. (A) An 8-min diameter map (DMap) of a small intestine, from the hepatoduodenal ligament to 31 cm distal. Arrows on the spatiotemporal scale (bottom left) indicate the direction of time and the proximal to distal axis. The intensity scale (bottom) gives the diameter of the intestine. The DMap shows three complete clusters demarcated by gaps g1 - g4. p indicates a y-shaped inhibitory patch. The four white stripes parallel with the time axis correspond to Peyer’s patches that increase diameter at those points. (B) Box b from panel (A). p - r are isolated inhibitory patches. s1 - s5 are a rhythmic series of inhibitory patches. d are fork dislocations (just above letter). (C) Box c from panel (A). p - r are isolated inhibitory patches. d are dislocations. The dotted arrows indicate propagation of dark bands. The scaling is the same as (B). (D) Ten second rhythm in a different intestine from panels (A–C).

