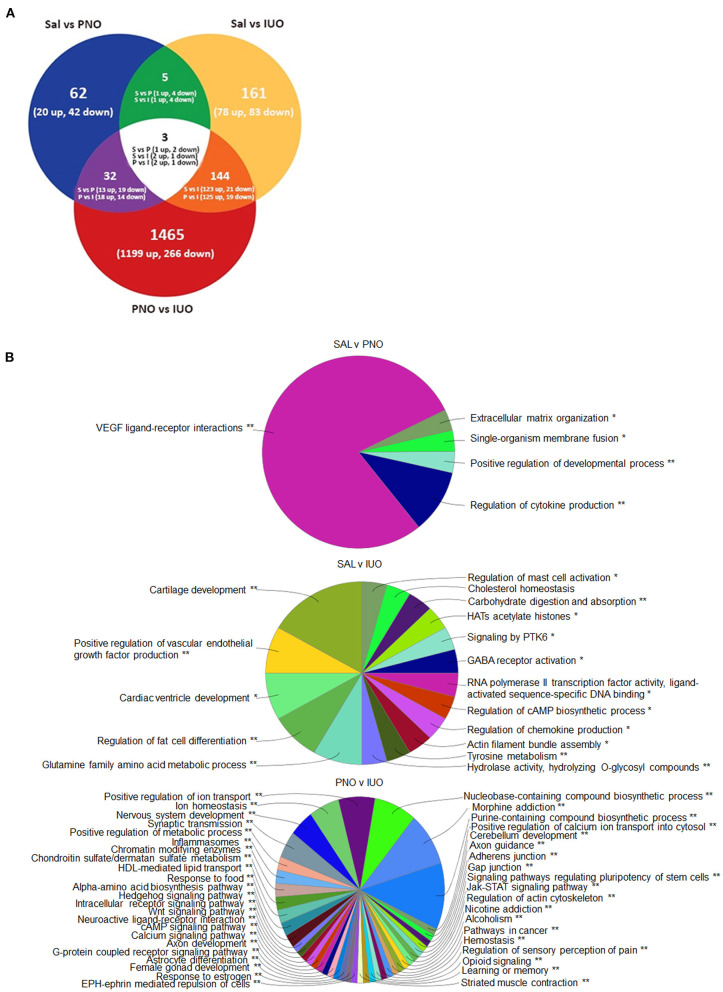
Figure 3.
Alterations in gene expression revealed by RNA-seq. (A) Differentially expressed genes at P14 identified using RNA-Seq. RNA was isolated from the PFC regions of P14 brains (n = 6) for each group. (B) Mapping of biological processes in the PFC. Clue-Go pie diagrams resulting from RNA-seq data show enriched biological processes involved in developmental, neurological, and psychological disorders, which are more impacted in the IUO offspring. The asterisks represent the group term p-value representing each category. *p < 0.05, **p < 0.01.

