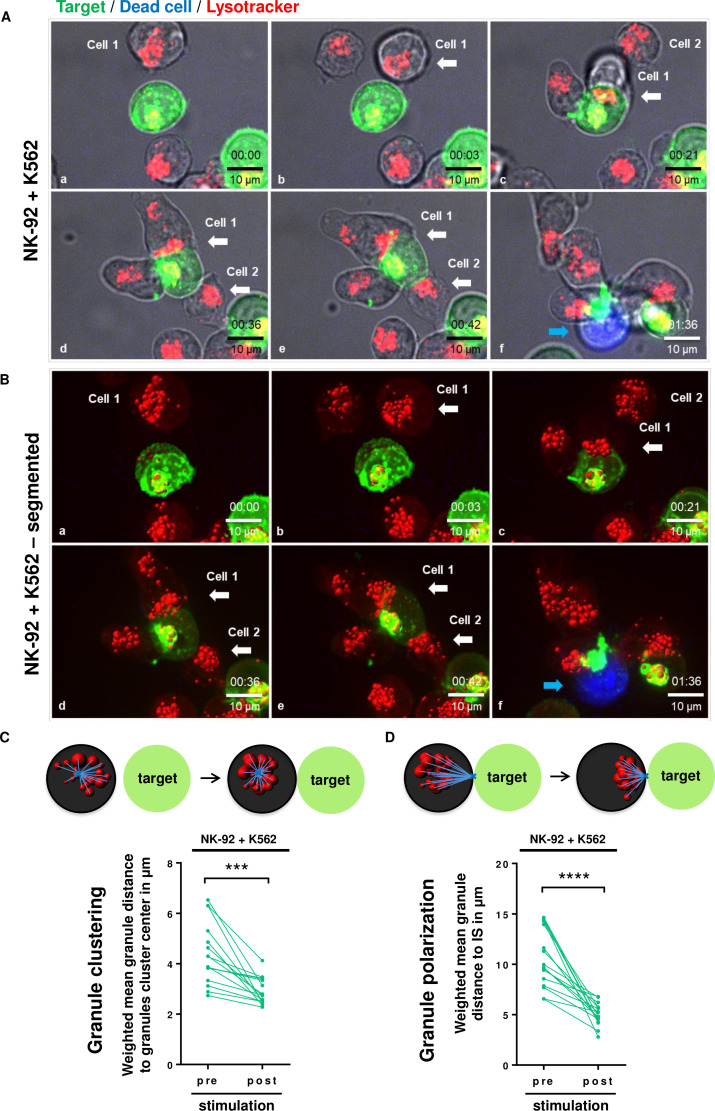
Figure 2.
NK cells cluster and polarize lytic granules after contact with the susceptible cell line K562. (A) Lytic granules of NK-92 were stained with Lysotracker (red), and live-cell imaging of NK-92 cocultured with susceptible K562 cells was performed. White arrows show conjugates, and blue arrows show dead cells. Representative images are shown. Time in hh:mm. (B) Granules were further segmented using Imaris software for quantification. (C) Lytic granule clustering was measured as the mean distance of single granules to the granules cluster center (replacing the microtubule-organizing center). (D) Granule polarization was measured as the mean distance of single lytic granules to the immunological synapse (IS), identified as the conjugation point of NK and target cells in 3D reconstructed images. Granule clustering and polarization in each cell was followed and analyzed before (pre) and after (post) stimulation with target cells. Only cytotoxcic NK cells that formed conjugates were counted. Each dot represents the mean of granules per cell per experiment. Data represent at least 3 independent experiments. 3D, 3 dimensional; NK, natural killer. ***P<0.001, ****P<0.0001.

