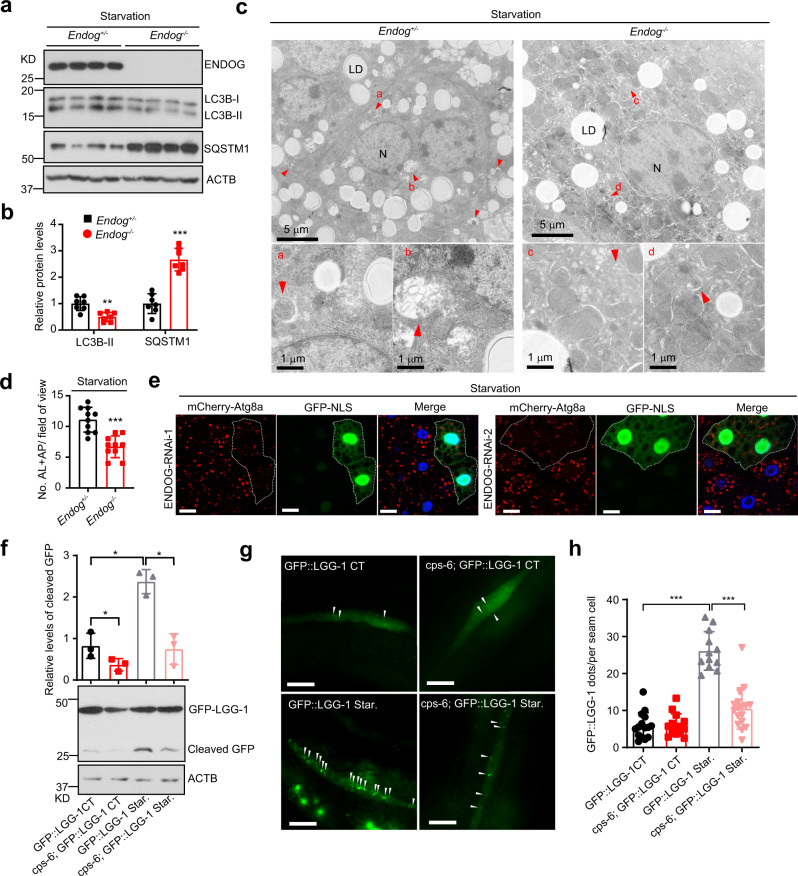
Fig. 2. Loss of ENDOG represses starvation-induced autophagy in different species.
a, b. Western blots and quantification of LC3B and SQSTM1 in Endog+/− or Endog−/− mouse livers after starvation for 24 h (n = 7 biologically independent animals; data are presented as mean values ± SD; **p < 0.01, ***p < 0.001). c, d Representative electron microscopic images and quantification of autophagic vesicles in Endog+/− or Endog−/− mouse livers after starvation for 24 h (LD: lipid drop; N: nuclear; red arrow: autophagic vesicle; n = 10 independent fields, data are presented as mean values ± SD, ***p < 0.001). e Representative images show that ENDOG knockdown decreased autophagosome accumulation (mCherry-Atg8a puncta) in Drosophila fat body cells after starvation for 4 h (GFP-NLS-labeled cells circled by dotted line express RNAi targeting ENDOG. Cells outside the circled dotted line are wild-type and used as controls; scale bar = 10 μm). f Representative western blots of GFP-LGG-1 and ACTB in control (GFP::LGG-1) and ENDOG loss function mutant (cps-6; GFP::LGG-1) C. elegans after starvation for 4 h. Graph, quantification of cleaved-GFP (correspond to a product of degradation in autolysosomes) (n = 3 biologically independent experiments, data are presented as mean values ± SD, *p < 0.05). g, h Representative images (g) and quantification (h) of GFP-LGG-1 puncta per seam cell in C. elegans (white arrows: GFP-LGG-1 puncta; n = 10–15 biologically independent C. elegans, scale bar = 10 μm; data are presented as mean values ± SD, ***p < 0.001). Source data are provided as a Source data file.

