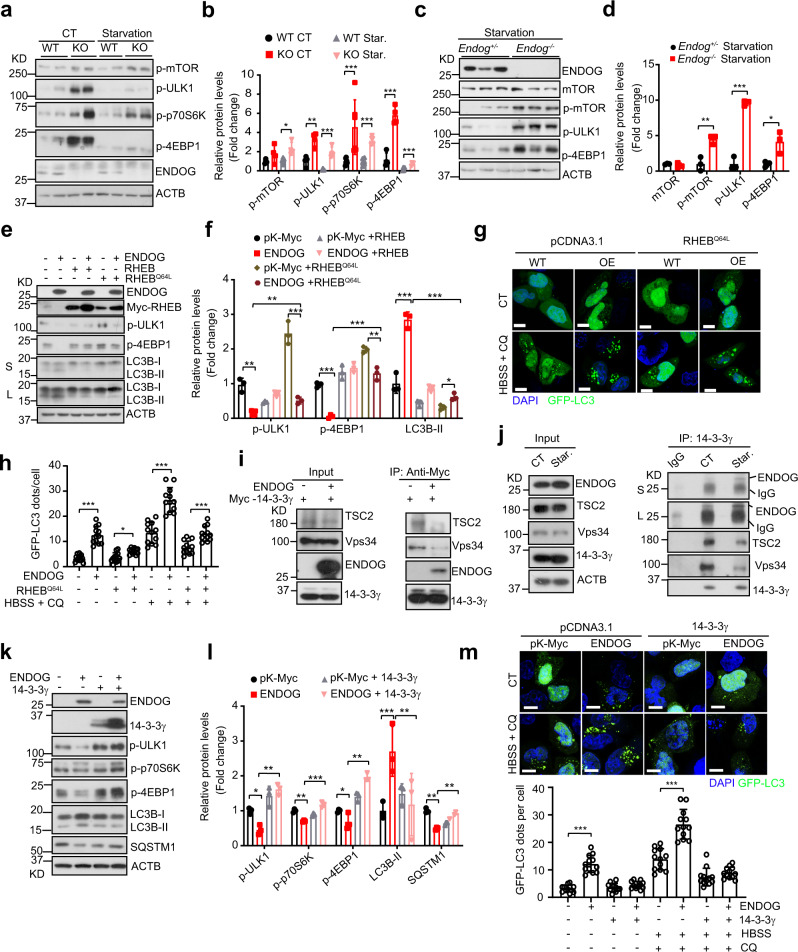
Fig. 3. ENDOG promotes autophagy by suppressing the mTOR pathway through its interaction with 14-3-3γ.
a, b Representative western blots and quantitative results of p-mTOR and mTOR’s substrates (p-ULK1, p-p70S6K, and p-4EBP1) in wild-type and ENDOG knockout L02 cells following the starvation for 6 h (n = 4 independent samples, data are presented as mean values ± SD, *p < 0.05; **p < 0.01; ***p < 0.001). c, d Representative western blots and quantitative results of the indicated mTOR signaling pathway proteins in Endog+/− and Endog−/− mouse liver after starvation for 24 h (n = 3 independent animals, data are presented as mean values ± SD, *p < 0.05; **p < 0.01; ***p < 0.001). e, f Representative western blots and quantitative results of the indicated mTOR signaling pathway proteins in ENDOG and RHEB/RHEBQ64L co-expressed L02 cells (S: short time exposure; L: long time exposure; n = 3 independent experiments, data are presented as mean values ± SD, *p < 0.05; **p < 0.01; ***p < 0.001). g, h Representative immunofluorescence images of GFP-LC3 puncta (g) and respective quantitative results (h) in ENDOG and RHEBQ64L co-overexpressed L02 cell under normal and HBSS + CQ conditions (WT: wild-type; OE: ENDOG overexpressed; RHEBQ64L transiently transfected for 48 h; starvation for 6 h; CQ: 50 μM for 6 h; scale bar = 10 μm; n = 100 independent cells examined over 3 independent experiments; data are presented as mean values ± SD, *p < 0.05; ***p < 0.001). i Co-IP experiments showed that ENDOG overexpression decreases interactions between 14-3-3γ with TSC2/Vps34 (L02 ENDOG-KO cell co-overexpressed Myc-14-3-3γ with Flag-ENDOG or empty vector for 48 h; biological repeated three times). j Endogenous Co-IP experiments showed that starvation enhances the interaction between ENDOG and 14-3-3γ but weaken the interaction of TSC2/Vps34 with 14-3-3γ (in L02 WT cell; Star.: starvation for 12 h; S: short time exposure; L: long time exposure; biological repeated three times). k, l Representative western blots and quantitative results of the mTOR pathway and autophagy-related proteins in ENDOG or 14-3-3γ overexpressing L02 cells (ENDOG or 14-3-3γ transiently transfected for 48 h; n = 3 independent experiments; data are presented as mean values ± SD, *p < 0.05; **p < 0.01, ***p < 0.001). m Representative immunofluorescence images of GFP-LC3 puncta (upper) and respective quantitative result in ENDOG or 14-3-3γ overexpressing L02 cells (lower). (HBSS: starvation for 6 hours; CQ, 50 μM for 6 h; scale bar = 10 μm; n = 100 independent cells examined over 3 independent experiments; data are presented as mean values ± SD,; ***p < 0.001). Source data are provided as a Source data file.

